What is Embedded Debugger (EDBG)?
The Atmel Embedded Debugger (EDBG) is an on-board debugger for kits with Atmel devices. EDBG enables the user to debug the target device without an external debugger. EDBG also brings additional features with a Data Gateway Interface (DGI) and a Virtual COM Port for streaming of data to a host PC. The Atmel EDBG will enumerate as a composite USB device with separate interfaces for each function. The Atmel EDBG is embedded on all Xplained Pro evaluation kits
What is Data Gateway Interface (DGI)?
The Atmel Embedded Debugger (EDBG) offers a Data Gateway Interface (DGI) for streaming data to a host PC. This is meant as an aid in debugging and demonstration of features in the application running on the target device. DGI consists of multiple interfaces for data streaming. The supported interfaces are SPI Interface, USART Interface, TWI Interface, GPIO Interface.
What are the interfaces supported by DGI in SAM D20 XPRO Kit?
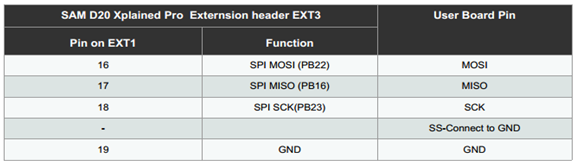
SAM D20 XPRO Kit Data gateway interface supports SPI and TWI. Port pin details are given in the figures:


Does QTouch Analyzer support DGI?
Yes, QTouch Analyzer can communicate to the EDBG DGI. The touch data (QDebug protocol) from SAM D20 can be sent through SPI/TWI channels to EDBG DGI. The DGI further transmits data to QTouch Analyzer through USB-WinUSB.

Currently the QTouch Analyzer supports the DGI from SAM D20 XPRO board.
How to send QDebug data from SAM D20 to EDBG-DGI (using SAM D20 XPRO and QT1 extension board)?
-
Click File> New> GCC QTouch Executable Project.
-
Select number of Sensors in the Kit Design Page.
-
Select the device SAMD20J18 in the device selection page.
-
In the advanced Option Page, Enable QDebug data and select Software Implemented SPI.
-
Select the SPI Pins as shown in Figure. (The EDBG SPI is set to operate in slave mode and the target device in master mode)
Figure 4. SPI Port Pin details when using DGI
-
Finish the wizard and generate the project. Flash the created project to the SAM D20 XPRO kit.
-
To analyze the touch data in the QTouch Analyzer, Attach the kit to PC and open QTouch Analyzer in Atmel Studio. A kit named QDebug_DGI will be listed in the combo box. Select the kit and press the connect button. DGI settings dialog box will be displayed as shown in the figure
Figure 5. DGI Settings window in QTouch Analyzer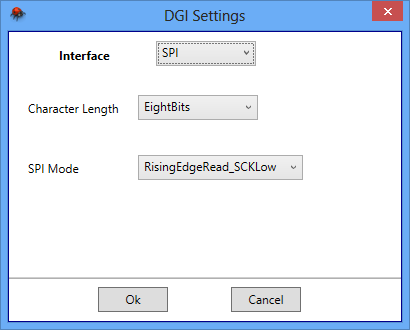
How to program/debug the user board/customer Board using SAM D20 Xplained Pro board?
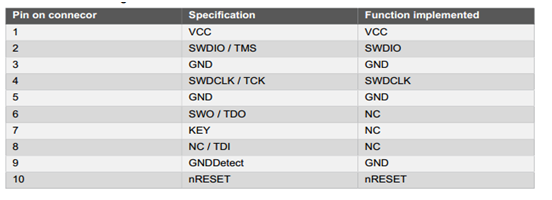
The SAM D20 Xplained Pro features a Cortex® Debug Connector (10-pin) for programming and debugging an external target. The connector is limited to the SWD interface and is intended for in-system programming and debugging of SAM D20 devices in the users final products.
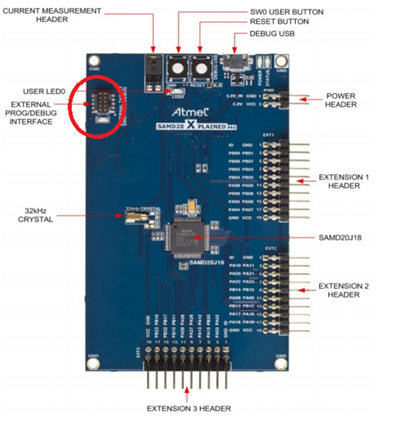
The debug connector is connected to the on-board EDBG through level shifters and switches. When an external target voltage is detected, the EDBG will switch the SWD interface from the on-board target device to the external debug connector and the green LED next to the connector will be lit. The voltage of the external target must be between 1.6V and 5.0V.
How to send QDebug data from the Customer Board to the QTouch Analyzer through SAM D20 Xpro Kit?
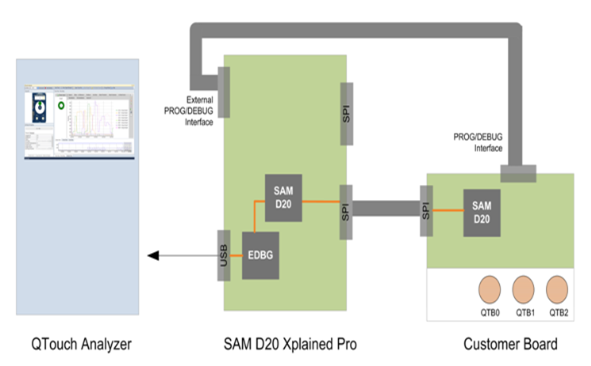
SAM D20 XPRO board can be used to receive QDebug data from Customer board and send it to QTouch Analyzer via EDBG’s DGI (as shown in Figure). To stream QDebug data from user board to QTouch Analyzer, a relay firmware should be flashed on to the SAM D20 XPRO Kit.
-
Go to QTouch Start Page (By Clicking icon in Atmel studio tool box)
-
Select the XPRO Kit in the Connected Kits.
-
Right Click on the Connected Kits and select Enable user board analysis
Figure 9. Enable userboard anlaysis option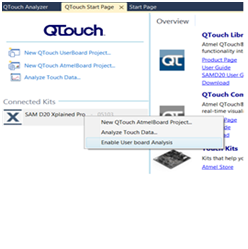
-
In the Enable user board analysis window, Click on the Flash button. Flash button burns the relay firmware into SAM D20 XPRO board. Relay firmware selects external SAM D20 as master and allows to send QDbeug data to EDBG DGI
Figure 10. Enabling User Board analysis window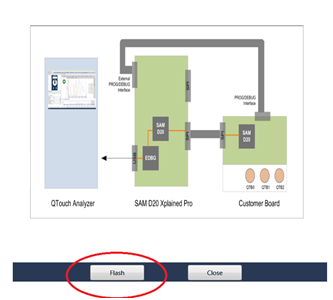
-
The below table indicates the SPI connection between XPRO kit and customer board.
Figure 11. SPI Connection table