Power Data view shows the power data information from the connected kit. When Start Reading is pressed, the power data will be presented in the view.
Figure 1. Power View
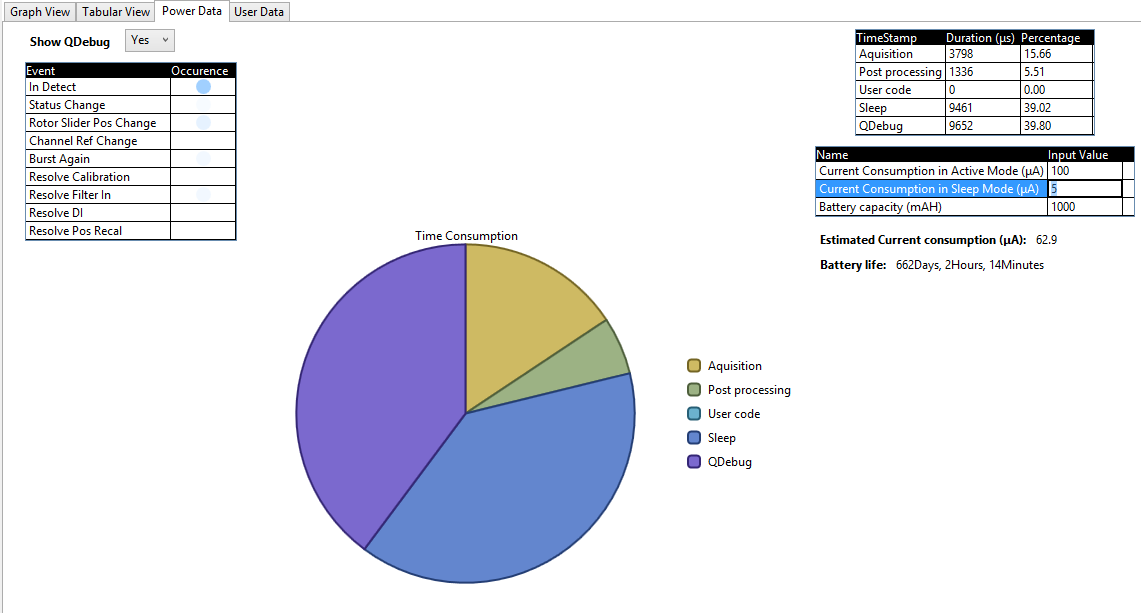
Time consumption is divided into five states that may be of interest, Acquisition, Post processing, QDebug, User Code and Sleep. The time consumption of these states and the percentage of time consumed by these states is presented into the state table ( Right top table).
Available events are presented in the Event table(Left top table) and a mark in the Occurrence is shown when the event occurs.
Figure 2. Power related Properties
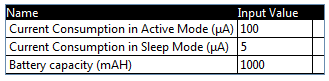
The above table receives input: 1.Current Consumption in Active
Mode, 2.Current Consumption in Passive Mode and 3.Battery
Capacity from the user and shows estimated current consumption and
battery life based on the above input parameter values and the power
consumption by the above events mentioned in the event table (Left top
table).