QTouch Analyzer provides near real-time visualization of the QTouch data sent from Atmel's QTouch kits, such as the QT600,TS2080,DGI of EDBG. And also allows user to perform run-time tuning of kits through setting of various QTouch library parameters on the kit.
The figure below shows the initial window setup for QTouch Analyzer, showing the views: Virtual Kit, Kit/Sensor Configuration and Trace. Other available views are Power Data, User Data and Tabular views.
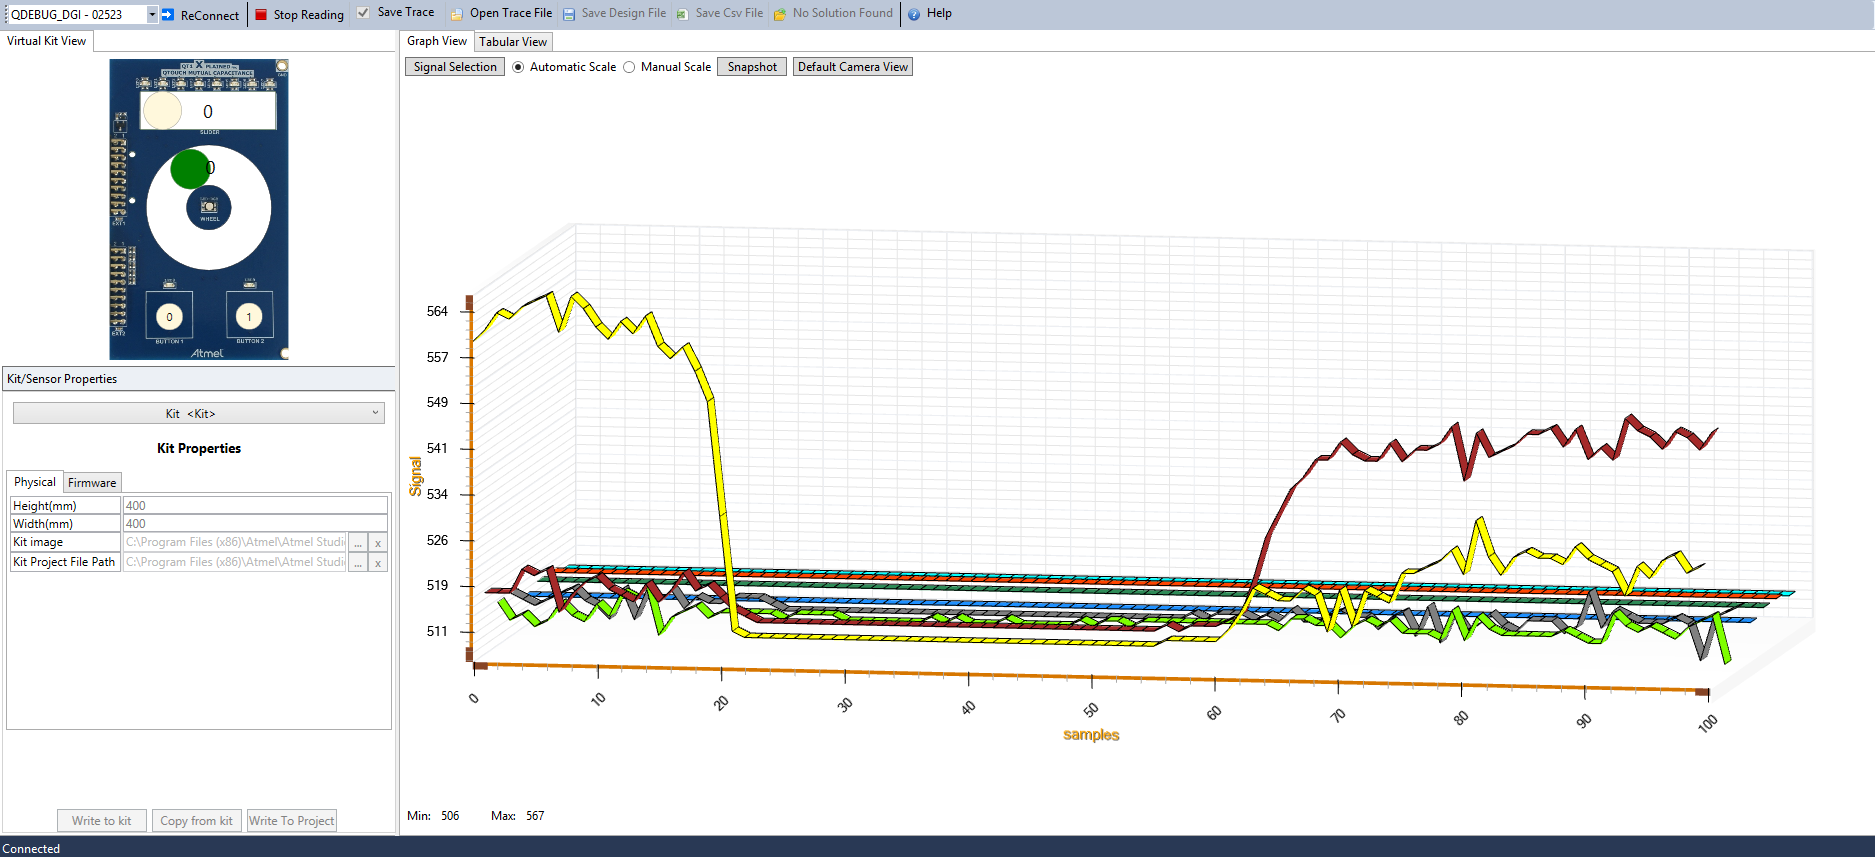
-
Connect/Reconnect
-
Start/Stop Reading
-
Save Trace
-
Open Trace File
-
Save Design File
-
Save Csv File
-
Open Solution File
-
Help
Connect/ReConnect
The combo box lists the QTouch kits attached to the system. The attached kit information is displayed (kit image, kit name and serial number). Select a kit and click Connect button. The kit gets connected to the Analyzer (connection status is marked with green tick mark in the combo box). The kit image will be displayed in the Virtual Kit section in QTouch Analyzer. Kit/Sensor configuration parameters are listed in the Kit/Sensor properties section in QTouch Analyzer.
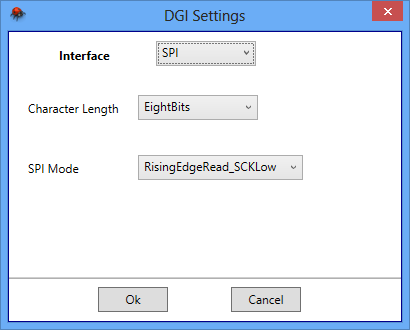
Start/Stop Reading
This menu allows user to start and stop reading touch data from the connected kit.If no kit is connected, this menu will be disabled. Clicking Start Reading will start capturing touch data from kit at regular intervals and the other views in QTouch Analyzer(Trace view,Tabular view and Kit/Sensor properties view) will get updated accordingly. Clicking Stop Reading will stop capturing touch data.
Save Trace
The Save Trace menu allows user to save the data in qtst files for future analysis.If no kit is connected, this menu will be disabled. By default,the save trace option is checked and qtst files are saved in the path provided in in the field Trace User Directory. The qtst files are saved inside time-stamped folders( the time at which start-reading touch data is initiated by user). During reading phase, this menu will get disabled and the user needs to stop reading to select/deselect the Save Trace option.
Open Trace File
This menu allows user to open the saved qtst trace files for analysis. Click on Open Trace File and select the qtst file for analysis.Graph view, surface view, tabular view, touch reporter view , user data and power views will then get updated based on the selected trace file. But during debugging phase, a message window will pop up to request stop reading data from kit. Click Yes to proceed the trace file analysis.
Save Design File
-
If the design file is found (design file project id matches with the project id of the connected kit) the Save Design File menu in the tool bar is disabled and the virtual kit view has been loaded with the design and image information specified in the design file.
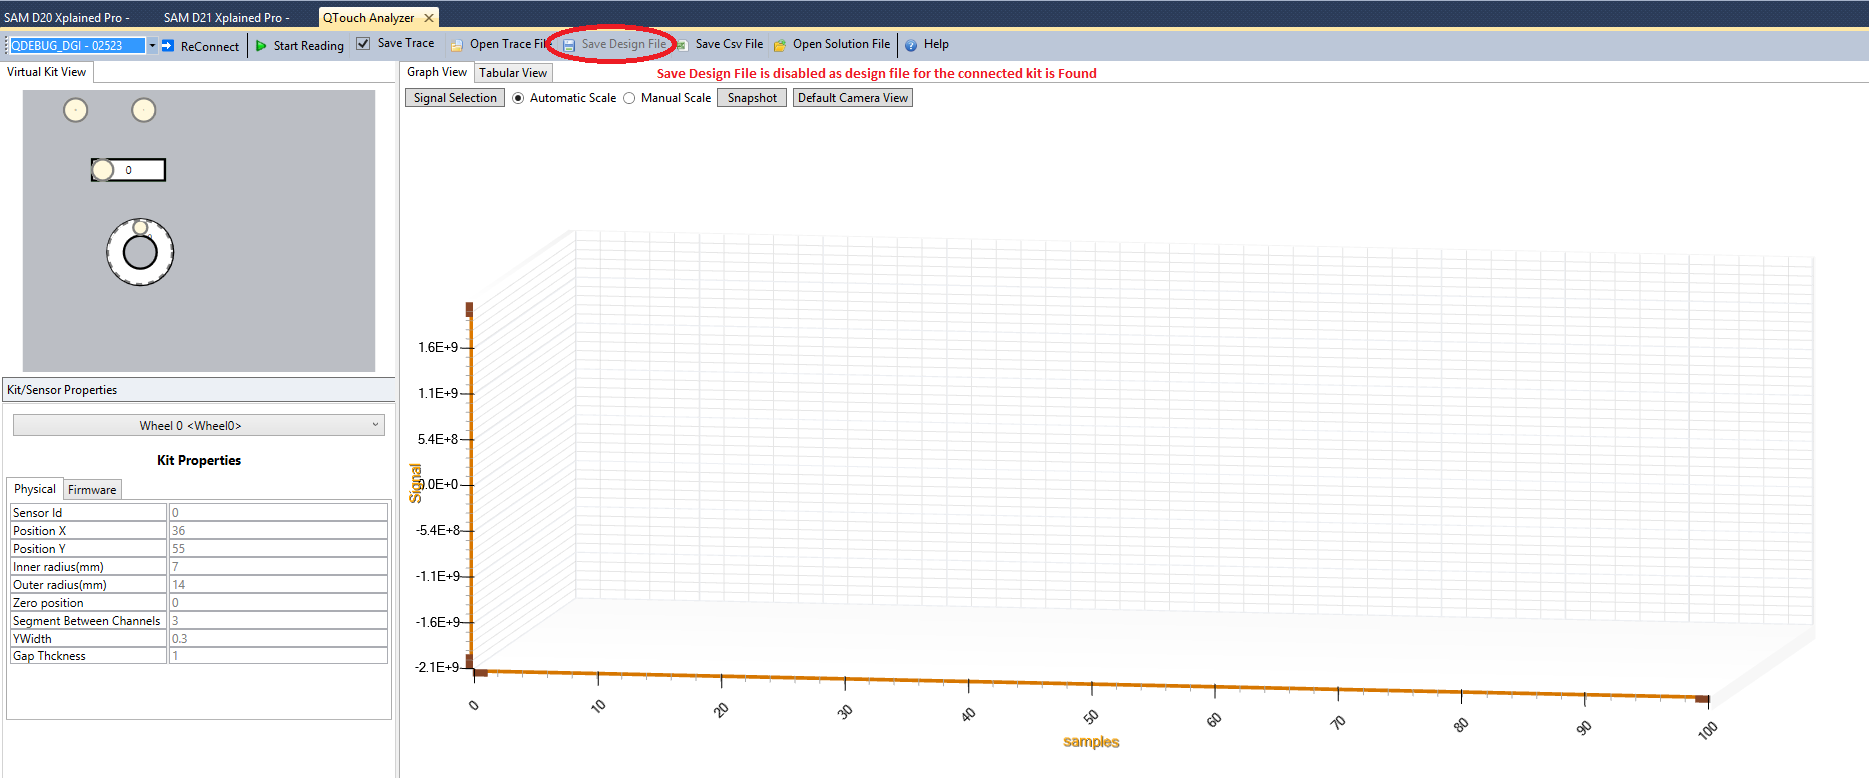
-
If the design file is not found the Save Design File button on the tool bar is enabled.
Provide the valid design file name in the dialog box for saving design file for the connected kit.
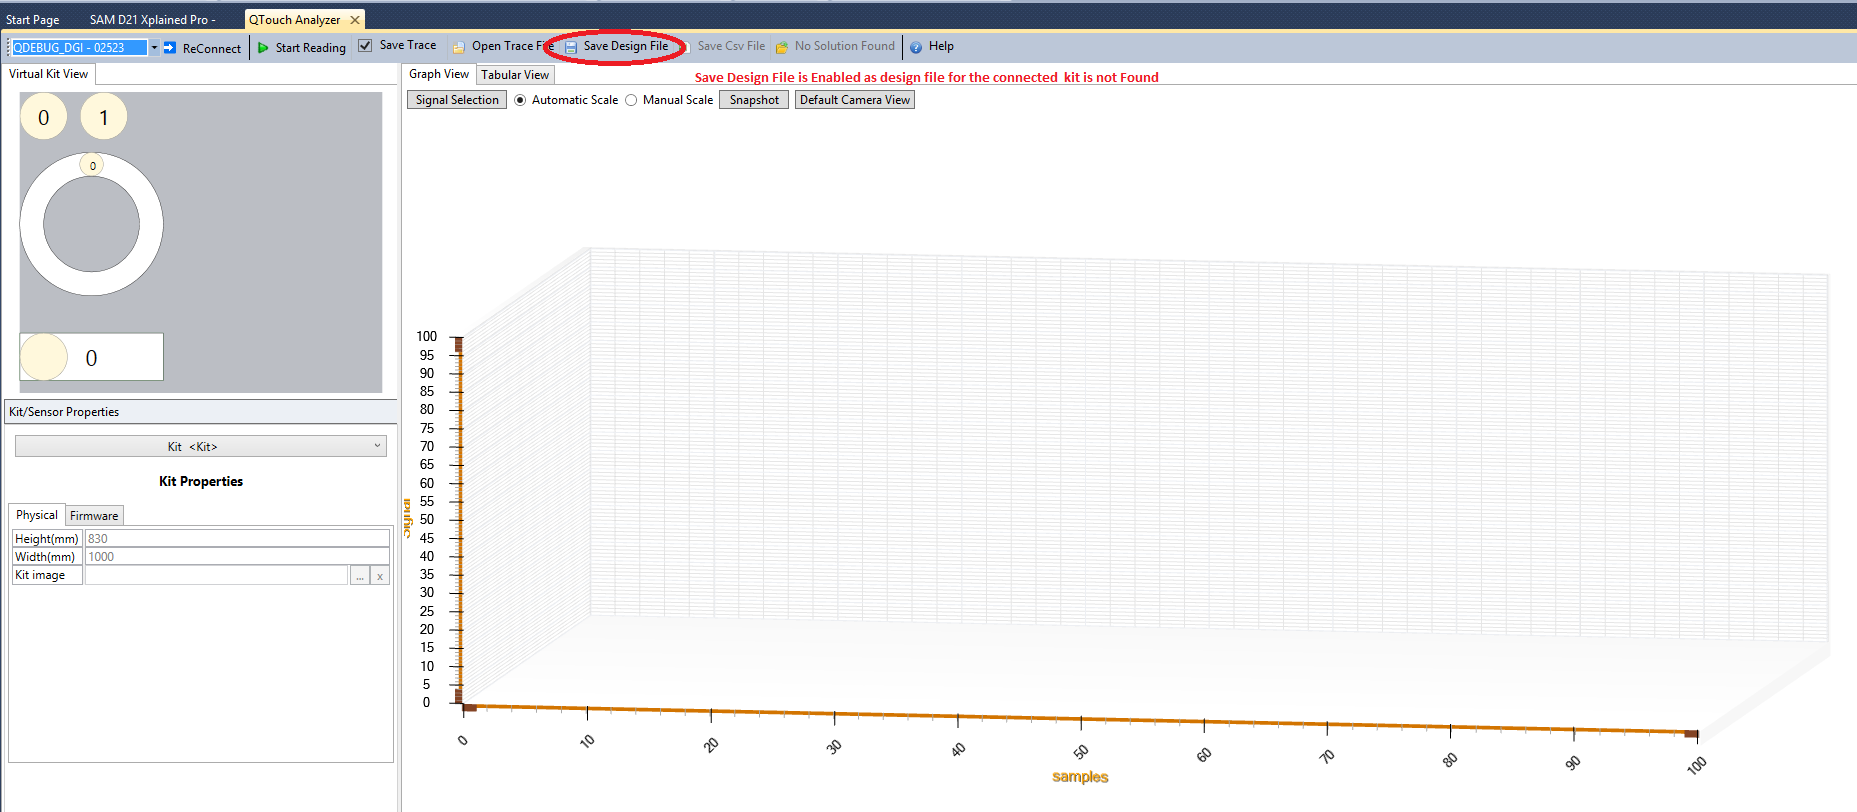
Save Csv File
This menu allows user to save the touch data of current session in comma separated value file. Signal, reference, delta and other touch related information with time stamps of the session will be stored in the csv file.
Open Solution File
This menu allows user to open the available solution corresponding to the project ID. It searches the solution for the project ID of the connected kit in the loaded solution and recently opened design files. If the solution is not found in either cases, this menu button will be disabled and will have text as No Solution Found on the other hand, if no kit is connected then, the button still be disabled and will have text No Kit Connected.
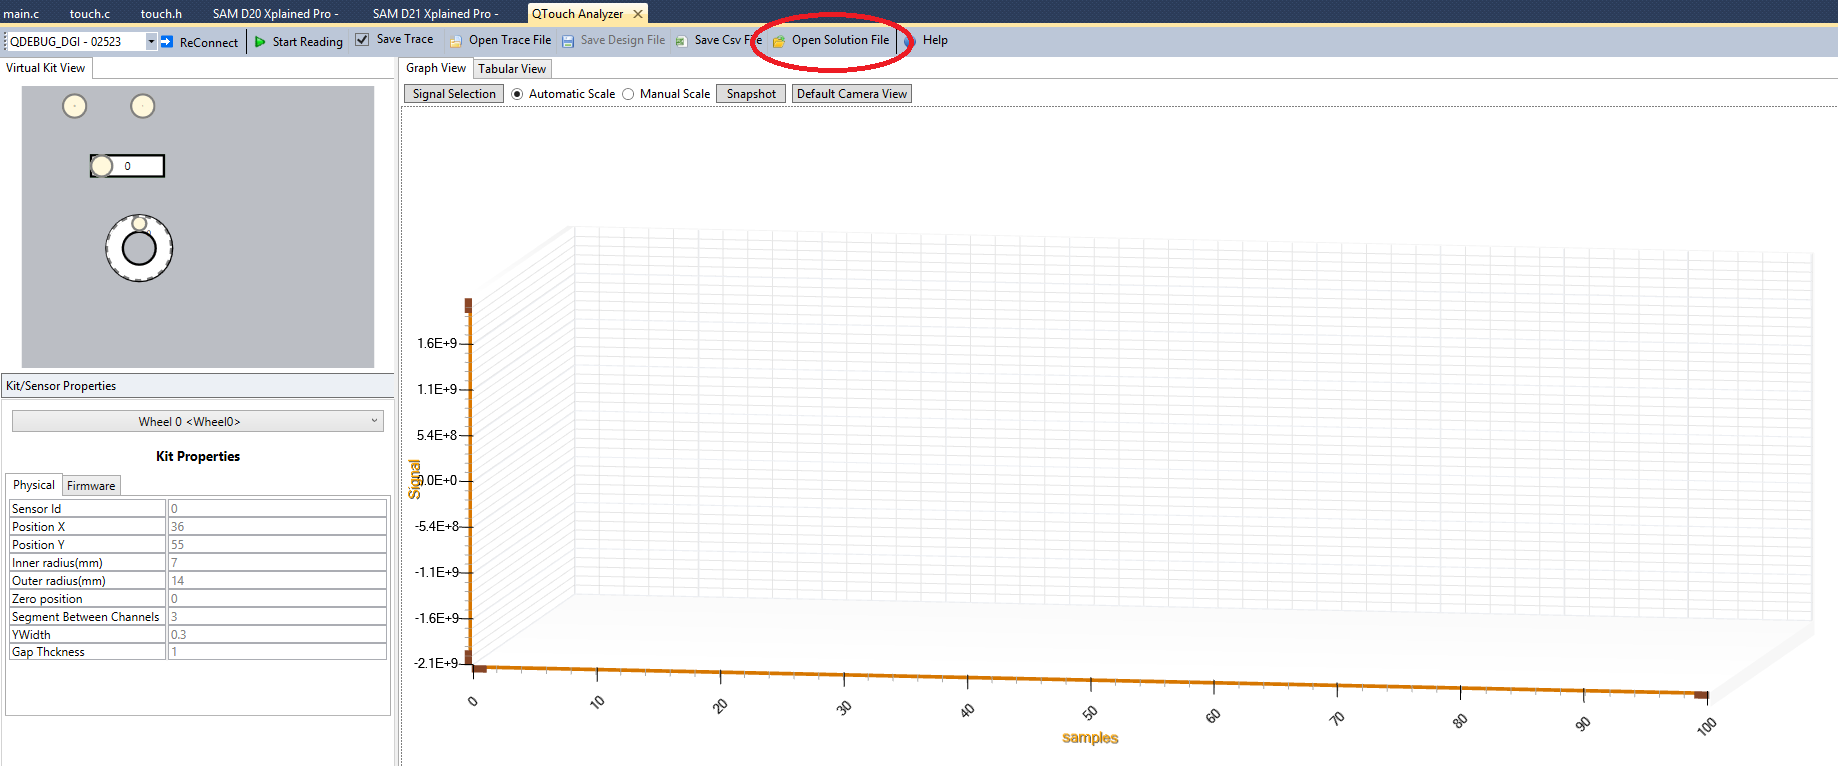
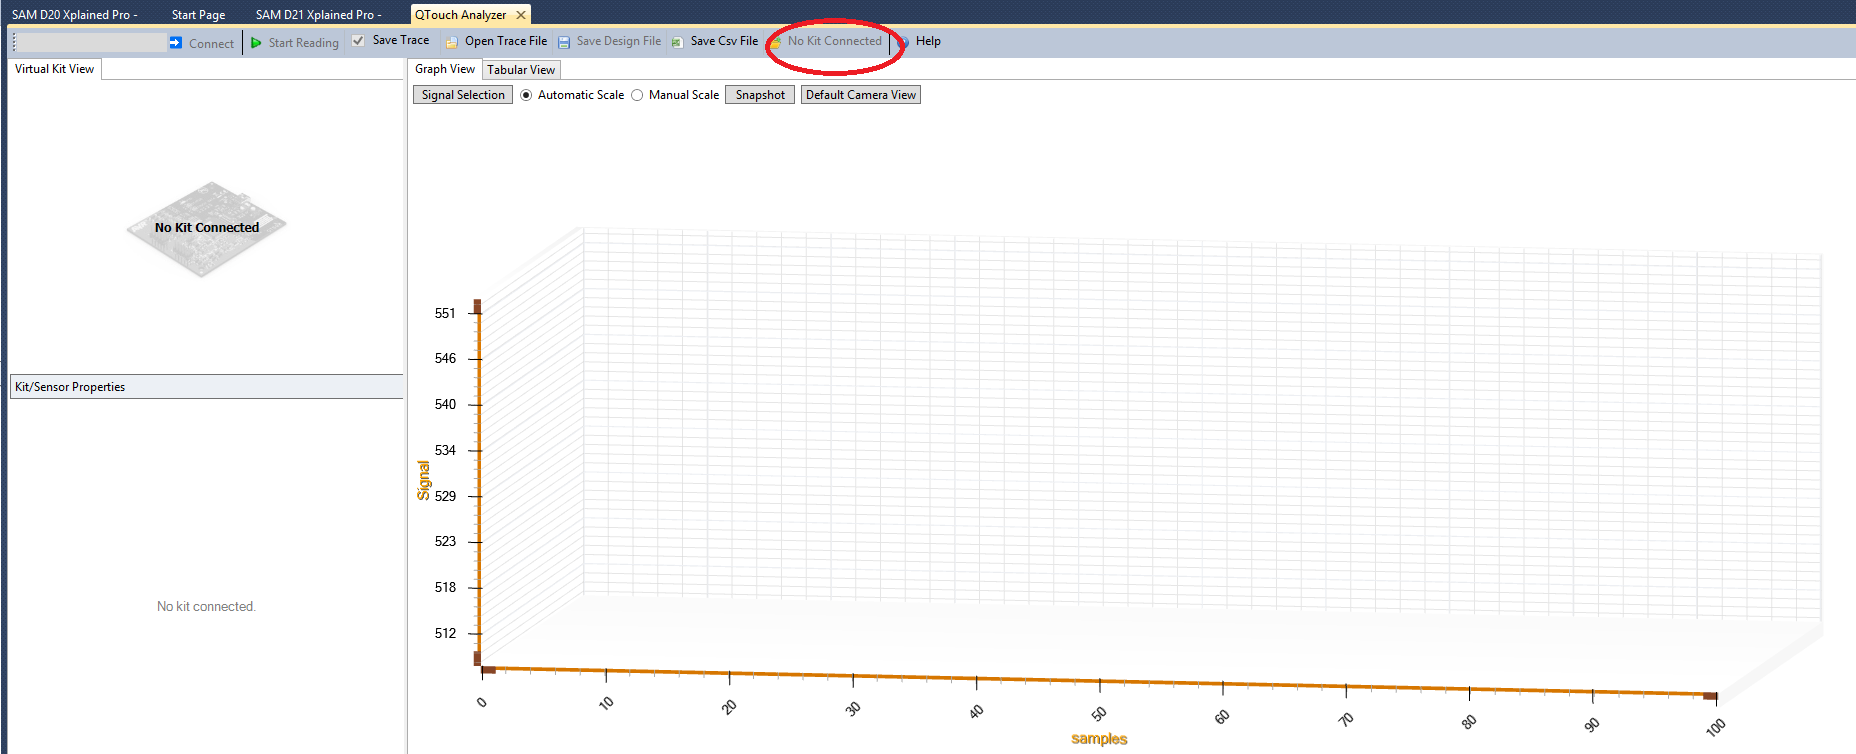
If the Solution is already loaded, it will display a message box showing Solution already loaded. If any other solution is already loaded , it will ask to close the current solution and to load the solution corresponding to the Kit Project ID.