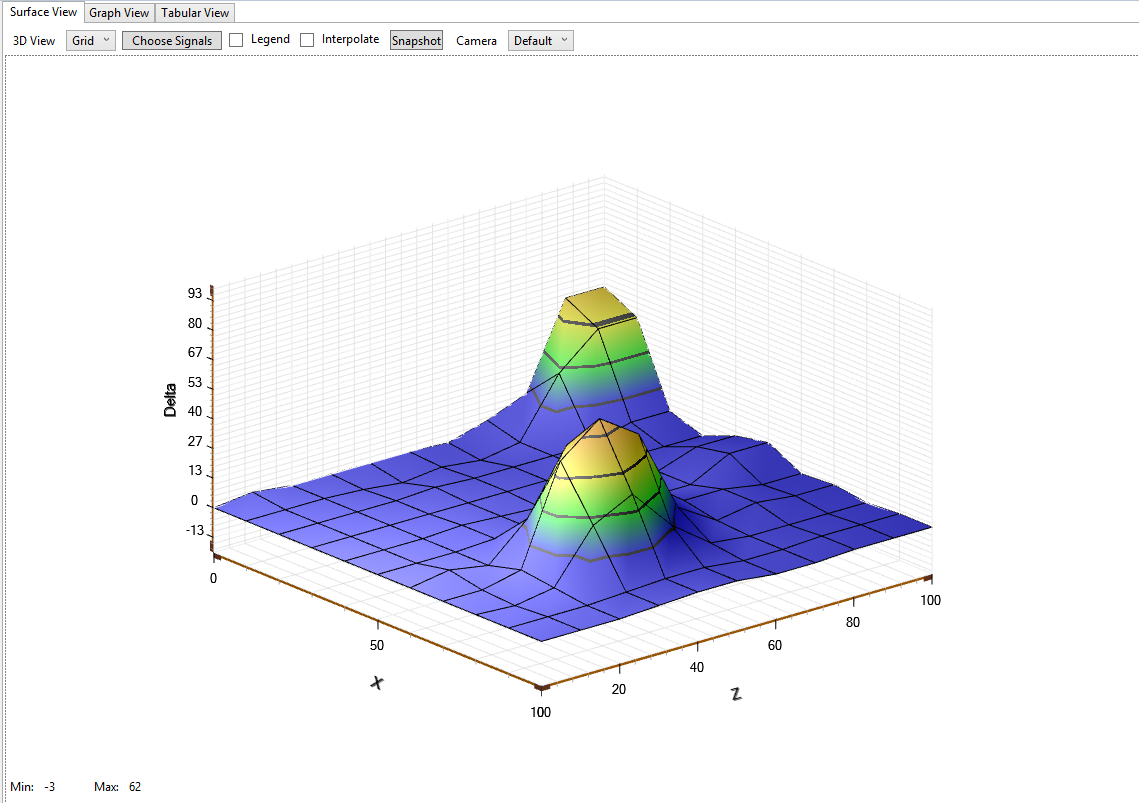
This view presents touch delta of surface sensor nodes in 3-Dimensional (3D) format. X-axis represents X resolution and Z-axis represents Y resolution of the surface kit respectively. Y-axis represents deltas of surface kit sensors.
Mesh and Grid type of 3-D views are available for selection. Grid type is enabled by default.
Surface view also allows the user to display delta values of selected sensor nodes alone. Use "Choose Signals" option to change the display settings of X resolution and Y resolution of surface kit respectively.
Legend check box is selected to view the range value of colours appearing in graph. In order to view smoother graph, User has provision to interpolate sensor delta values by enabling interpolate check box. This is useful to analyse jitter on sensor nodes.