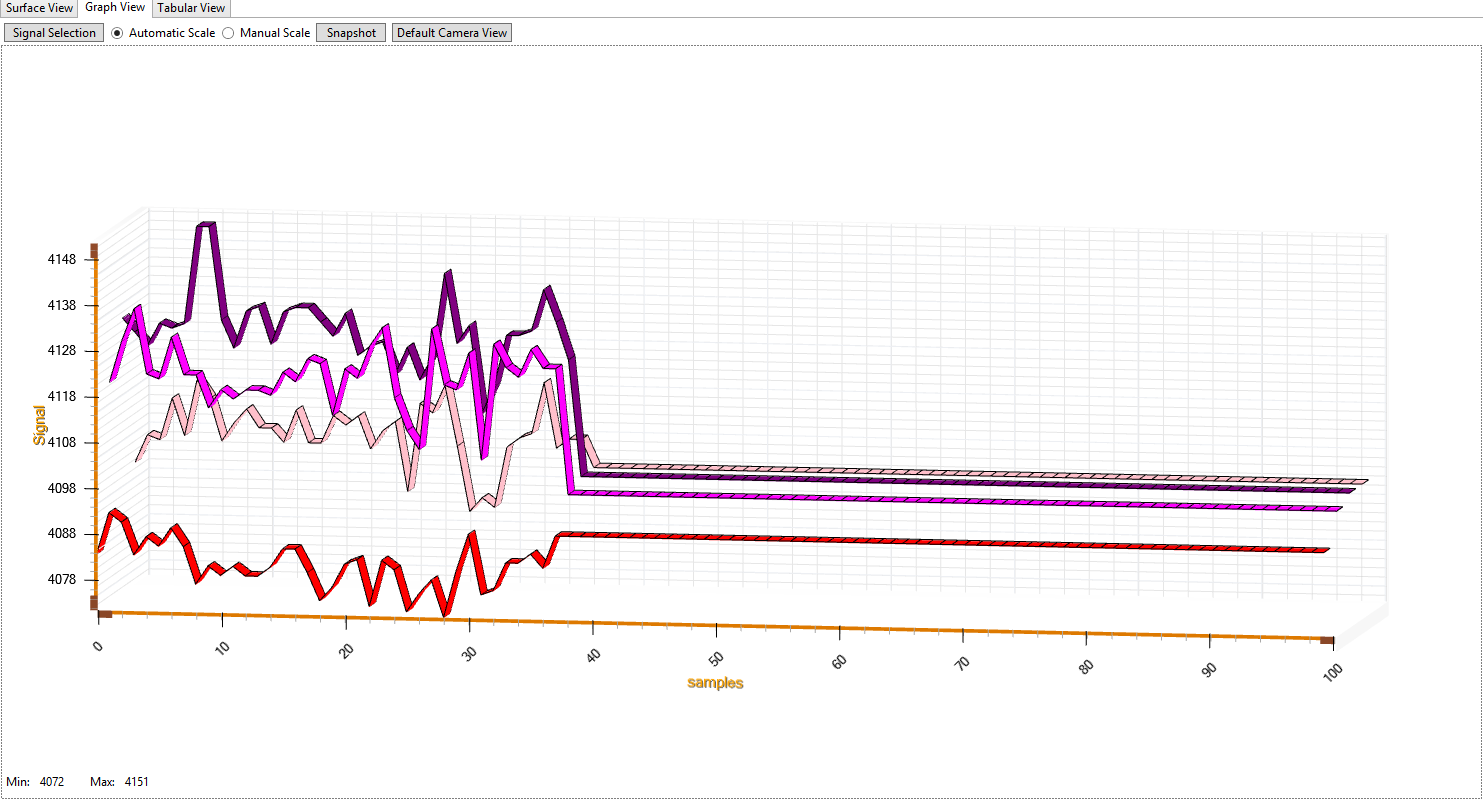
This view shows graphical representation of touch data.
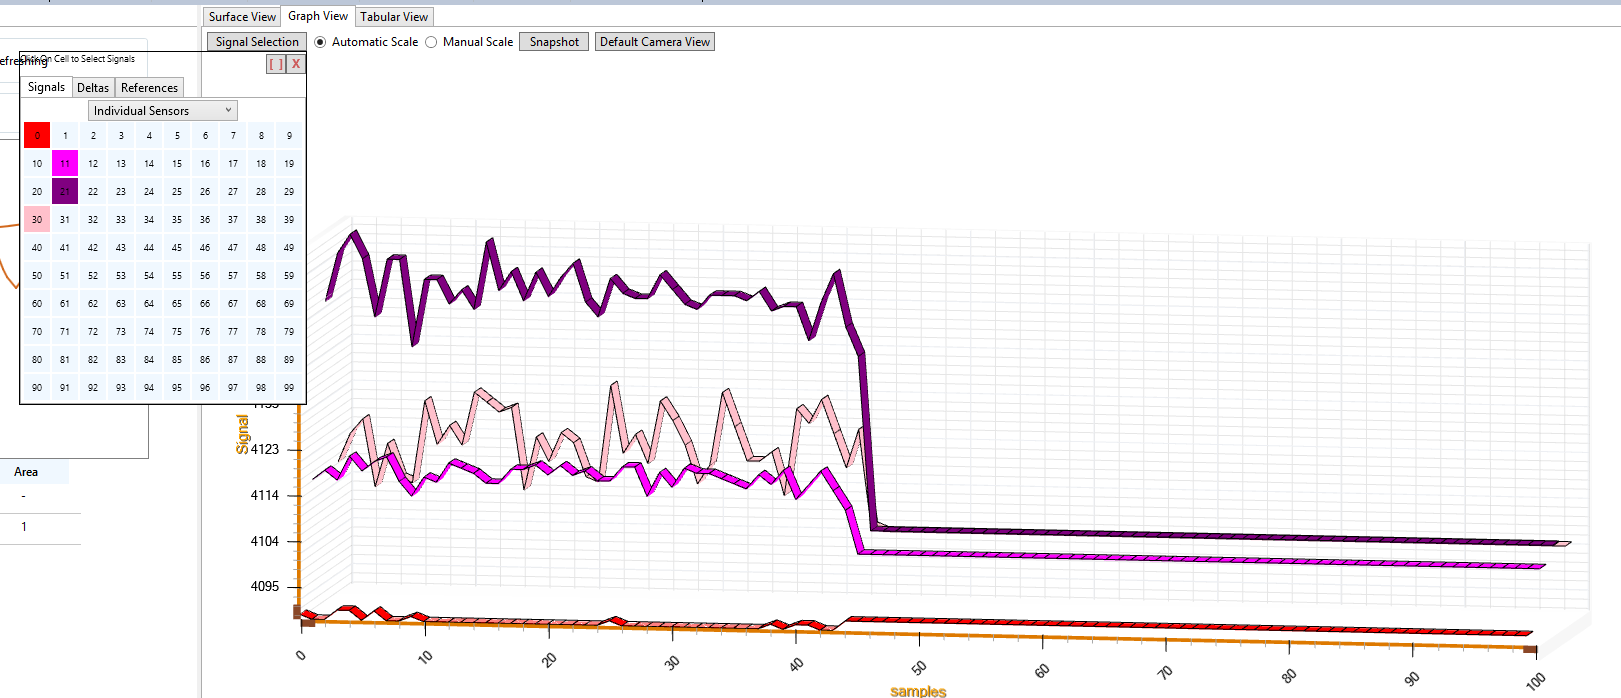
The nodes of surface kit are represented in two dimensional array. User has to click on the desired node to view the data in graph. User can select signals, deltas and references of individual sensors, sleep channels, segment channels, row line channels and column line channels.
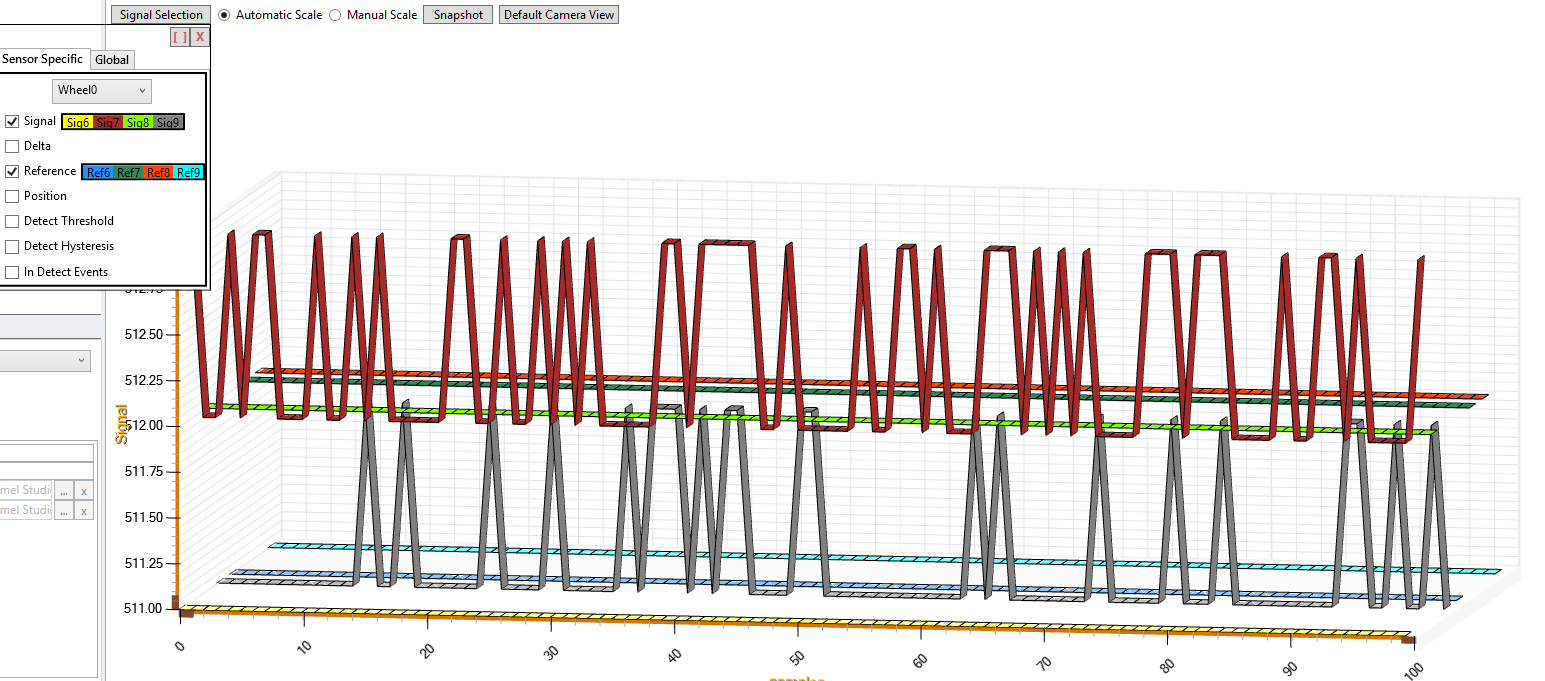
For other kits, sensor and global specific parameters are available for selection. Clear button in the top right section of the selection pop-up window clears all the selection and close button closes the pop-up window.
Automatic scale is enabled by default. Y axis scale varies depending upon the touch data value, if automatic scaling is enabled. User can also set fixed scale value by switching to manual scale. A pop up window will appear to set the minimum and maximum fixed value of Y axis respectively. Minimum and maximum values of touch data samples are updated continuously in the left bottom section of the view. Save snap-shot option allows user to save the snap shot of graph in png format. User can zoom in or zoom out the graph using mouse middle button. Default camera view sets default appearance settings to graph. Clicking the option will set Zoom in, Zoom out and graph positions to default values.