Data visualizer supports many widgets to visualize the data like terminal,
label, graph, etc. The continuous data and their types are parsed and displayed on the
appropriate elements using three scripts files having extensions of
*.db, *.ds, *.sc. These script
files are automatically generated by the Atmel START platform based on the project
configuration. Only the path of the scripts needs to be configured on the data
visualizer software. Data visualizer software is available both as a stand-alone
installable version as well as an extension on Atmel Studio IDE and can be downloaded
from the following link: https://gallery.microchip.com/policies/studio.
- 1.Create a configuration folder “dv_config” for data visualizer in the desired location.
- 2.Copy the dashboard configuration
(
.db, .ds,.sc) files from “..\thirdparty\qtouch\datastreamer” project folder to “dv_config” folder.Note: These files are not source files. They will not be automatically extracted to the project folder. To extract these files, rename theselfcap_3ch.atzipfile toselfcap_3ch.zip. Then extract the content. - 3.Open Data Visualizer.Note: If QTouch Debug data is sent using SPI or I2C interface, go to Step 6. If QTouch Debug data is sent using COM port, continue.
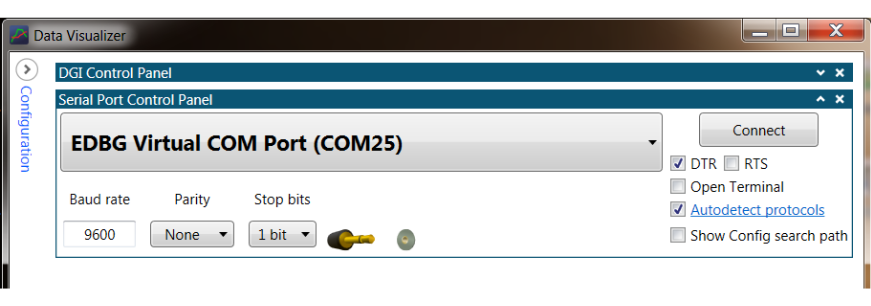
- 4.Double-click the serial port
control panel and click the Connect button to make a connection to the
target. Close the DGI control panel tab.
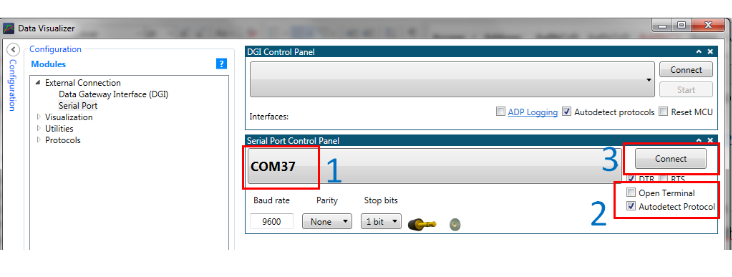
- 5.Another way to make the
connection is through the Configuration option on the left side. Expand
Configuration option and under External Connection option, double-click
on the Serial Port option and click the “Connect” button on the
serial port control panel. Restore the configuration option to a minimized
state.
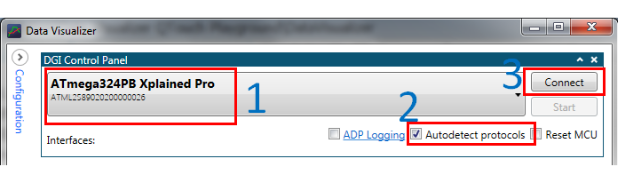
- 6.Select the desired kit, select
then the Autodetect protocol check-box, and click Connect.
- 7.For the very first time, Data
Visualizer will prompt the user to select the folder containing configuration
information as follows. Browse and select the
‘
dv_config’ folder and click OK.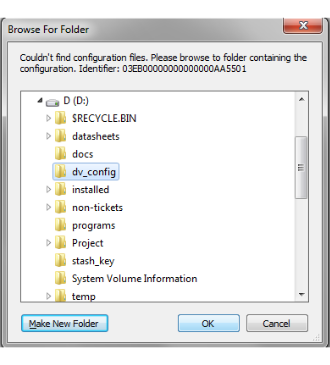 Alternatively, the path of the configuration folder ‘
dv_config’ can be specified in theconfig_pathtab as shown below. Click the check box option “show config search path” to enable the config path tab.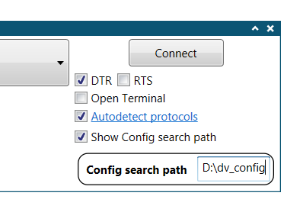 Note: The selected folder will be saved by the Data Visualizer. Data Visualizer will not prompt the user to select a folder for subsequent connections. If the sensor configuration is changed, the new dashboard configuration files from the Atmel START project need to be copied to this folder. Since the configuration file names are the same, the old files should be replaced with the new ones. The file names should not be modified.
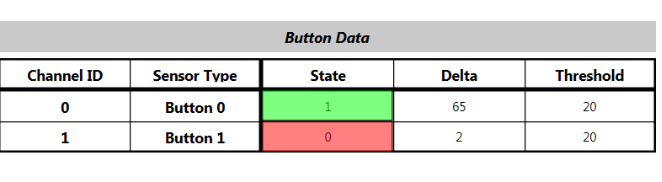
 - 8.The dashboard view contains three
sections of data displayed. The first section converts the status information of
all the configured buttons along with delta and threshold values.
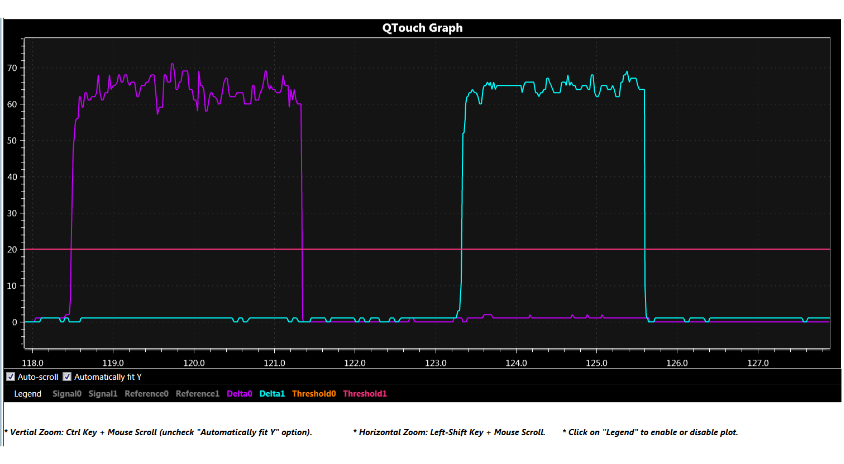
- 9.Section 2 shows the graph view
plotted with the signal, reference, and delta values of the configured channels,
as shown below. The plots can be enabled/disabled by clicking on the legends at
the bottom of the graph.
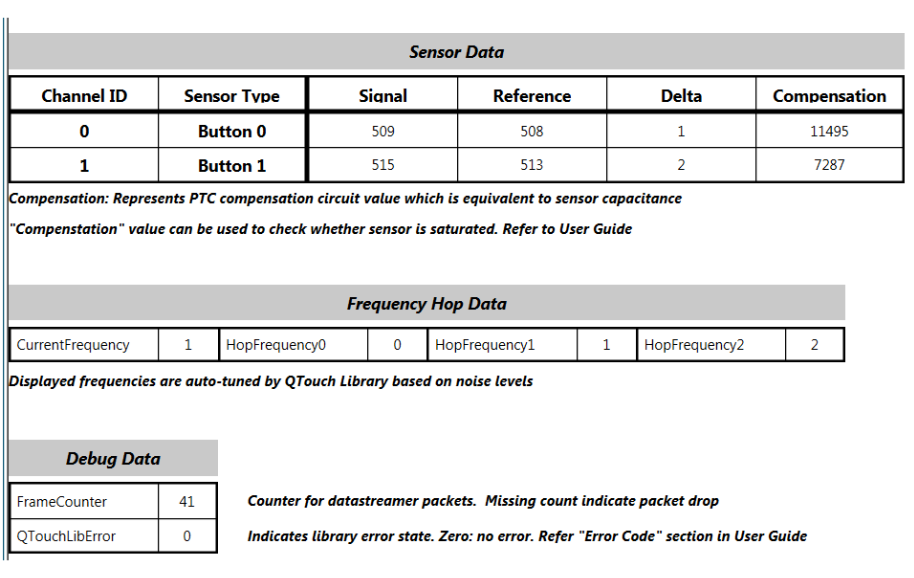
- 10.The third section displays the
table of data from Noise Immunity modules, detailed sensor information,
including Compensation Capacitance value, Error Status data.
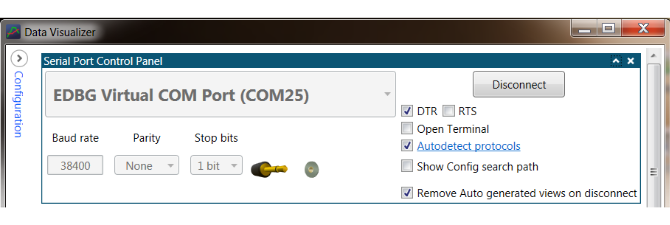
- 11.To disconnect the hardware, open
the Serial Port Control Panel by double-clicking on the tab, and click
the ‘Disconnect’ button, as shown below: