View disassembled C code in the Disassembly window. Select Window>Debugging>Disassembly to open this window. You must be in debug mode.
When debugging, the "Step Over" function works in the source code context. Disassembly debugging is done using the "Step In" function. If during Disassembly debugging "Step In" is not needed - for example in cases where a CALL instruction needs to be stepped over and not stepped in - this can be achieved by using the "Run to Cursor" feature. Place the cursor at the line where PC needs to be run to and hit the "Run to Cursor"/F4 button.
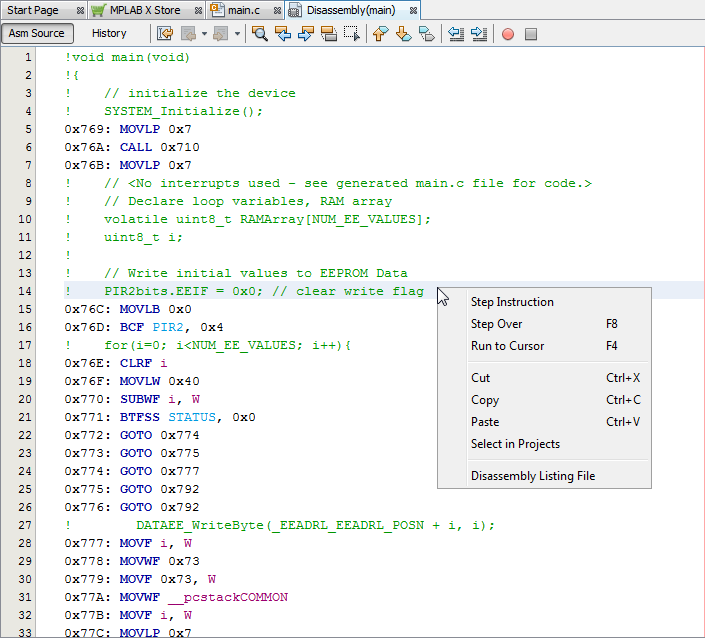
Right click in the window to see the context menu.
A quick way to view the entire disassembly file is to select “Disassembly Listing File.”
If your project device uses RAM banking, see also:
Banked Data Memory and Values Displayed in Windows