Todo:
- Program the Mass Storage Class example into the target device using Start Without Debugging (Ctrl+Alt+F5)
- Stop Data Visualizer after capturing a plot
With some scrolling and scaling the plots should look something like this:
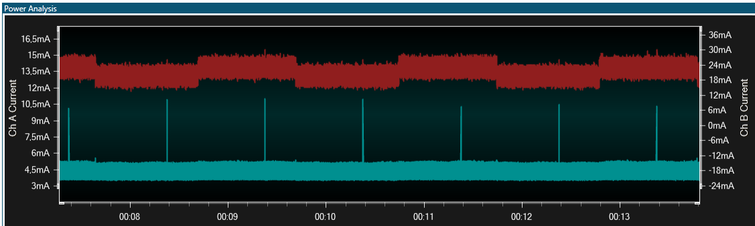
The red graph is channel B, and represents the current drawn by the entire board. It appears to toggle between two modes at about 1 second intervals. This is the LED toggling ON and OFF.
The blue graph is the A channel, and represents the current drawn by the target MCU only. It appears to draw about 4.5mA continuously, with pulses of up to 10mA, also at 1 second intervals.
Tip: Of interest: disabling
the USB 'disk' in the Windows device manager will stop this pulse from occurring,
indicating that this is probably triggered by an event from Windows.
Todo: Open
the Windows explorer and perform a format of the Mass Storage Device.
Caution: Take care to format
the right disk!
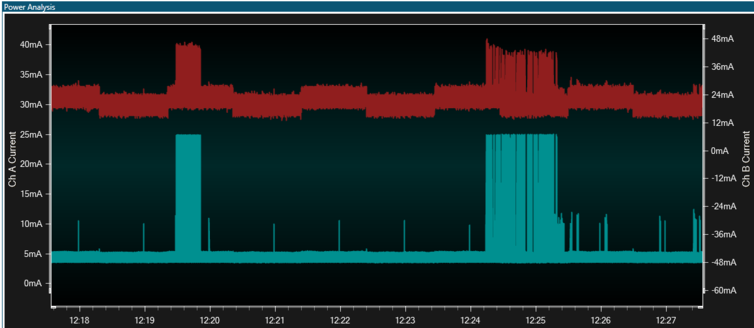
On the plot you should now see periods of much higher current consumption on both board and MCU channels, as shown here: