The Watch window and QuickWatch dialog box are places where you can enter variable names and expressions that you want to watch during a debugging session.
The QuickWatch dialog box enables you to examine a single variable or expression at a time. It is useful for taking a quick look at one value or a larger data structure. The Watch window can store several variables and expressions that you want to view over the course of the debugging session. Atmel Studio has multiple Watch windows, which are numbered Watch1 through Watch4.
A variable name is the simplest expression you can enter. If you are debugging native code, you can use register names as well as variable names. The debugger can accept much more complex expressions than that, however. For example, you could enter the following expression to find the average value of three variables:
(var1 + var2 + var3) / 3
The debugger accepts most valid language expressions in a Watch window. For more information, see Expression Formatting.
If you are programming in native code, you may sometimes need to qualify the context of a variable name or an expression containing a variable name. The context means the function, source file, and module where a variable is located. If you have to do this, you can use the context operator syntax.
Expressions that Affect the State of Your Program
Evaluating some expressions can change the value of a variable or otherwise
affect the state of your program. For example, evaluating the following
expression changes the value of var1:
var1 = var2
Expressions that change data are said to have side effects. If you enter an expression that has a side effect into the Watch window, the side effect will occur every time the expression is evaluated by the Watch window. This can produce unexpected results if you are unaware that the expression has side effects. An expression that is known to have side effects is only evaluated one time when you first enter it. Subsequent evaluations are disabled. You can manually override this behavior by clicking an update icon that appears next to the value.
Unexpected side effects are frequently the result of function evaluation. For example, you could enter the following function call into the Watch window:
PrintFunc1(var1)

Func1(var1)
If you call a function from the Watch window or QuickWatch, the function you are calling might change data, creating a side effect. One way to avoid possible unexpected side effects from function evaluation is to turn OFF automatic function evaluation in the Options dialog box. This disables automatic evaluation of newer language features, such as properties. However, it is safer.
The Atmel Studio debugger automatically expands common data types to show their most important elements. You can also add expansions for custom data types.
To evaluate an expression in the Watch window
- 1.In the Watch window, click
an empty row in the Name column. The debugger must be in break
mode at this point. Type or paste the variable name or expression you want to watch.
—or—
Drag a variable to a row in the Watch window.
- 2.Press ENTER.
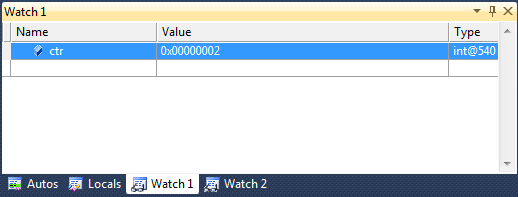
- 3.The result appears in the Value column. If you type the name of an array or object variable, a tree control appears next to the name in the Name column. Expand or collapse the variable in the Name column.
- 4.The expression remains in the Watch window until you remove it.
To evaluate an expression in QuickWatch
- 1.In the QuickWatch dialog box, type or paste the variable, register, or expression into the Expression text box.
- 2.Click Reevaluate or press ENTER.
- 3.The value appears in the Current value box.
- 4.If you type the name of an array or object variable in the Expression box, a tree control appears next to the name in the Current value box. Expand or collapse the variable in the Name column.
To reevaluate a previous expression in QuickWatch
- 1.In the QuickWatch dialog box, click the down arrow that appears to the right of the Expression box.
- 2.Choose one of the previous expressions from the drop-down list.
- 3.Click Reevaluate.