This tab allows you to select and change the debugger platform for the current project.
Click on the Device button on the Device and Debugger toolbar to get to this tab quickly while editing.

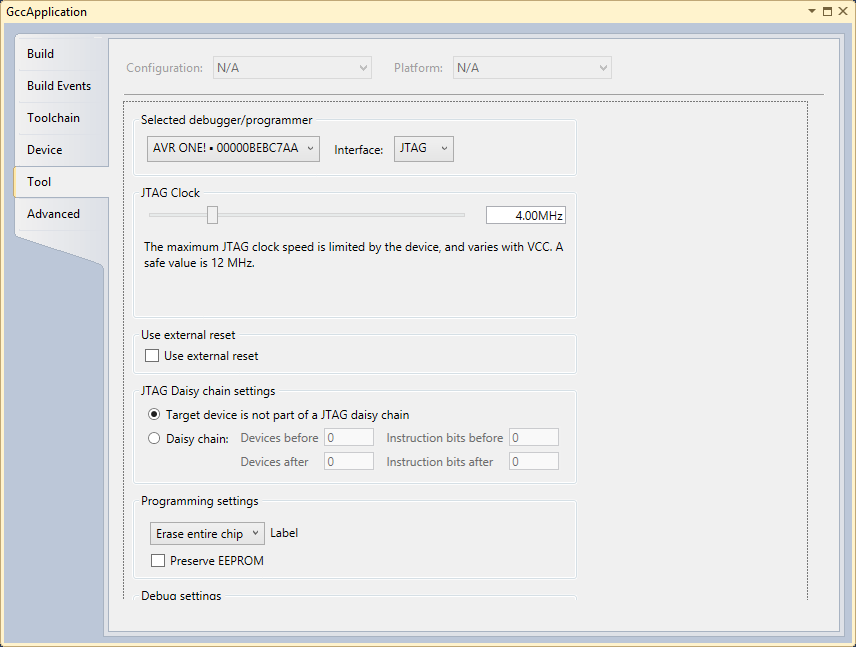
Select tool/debugger from the drop-down list. The current selection is shown.
Select Interface from the drop-down list. The current selection is shown.
Further Properties are dependent on the tool and interface selected.
JTAG
If you have selected JTAG as the programming interface clock speed, use external reset - and daisy-chain setting may be available. This depends on the tool and device.
JTAG clock
JTAG clock is the maximum speed the tool will try to clock the device at. The clock range is different for different tools and devices. If there are restrictions, they will be stated in a message below the clock slider.
The clock can be set to Manual (all tools), Auto (SAM-ICE only), or Adaptive (SAM-ICE only).
Use external reset
If checked, the tool will pull the external reset line low when trying to connect to the device.
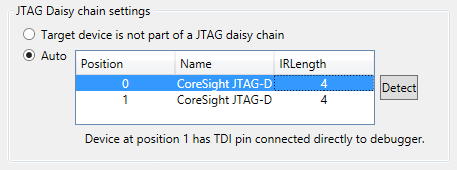
JTAG daisy-chain settings
Specify the JTAG daisy-chain settings relevant to the device to program.
Target is not part of a daisy-chain. Select this option when the target device is not part of a daisy-chain.
Daisy chain - Manual. Allows you to manually configure the JTAG daisy-chain in case you are programming in a system-on-board.
-
Devices before - specifies the number of devices preceding the target device.
-
Instruction bits before - specifies the total size of the instruction registers of all devices, preceding the target device.
-
Devices after - specifies the number of devices following the target device.
-
Instruction bits after - specifies the total size of the instruction registers of all devices, following the target device.
Daisy chain-Auto. Automatically detects the devices in the JTAG daisy-chain. Allows you to select the device in the JTAG daisy-chain. Auto-detection is supported only for SAM devices.
PDI
The PDI interface has only one setting – the PDI clock speed.
PDI Clock is the maximum speed the tool will try to clock the device at. The clock range is different for different tools and devices. If there are restrictions, they will be stated in a message below the clock slider.
The clock cannot be adjusted on all tools, so an empty Interface settings page will be presented.
Programming and debug settings
In the drop-down menu, it is possible to specify which parts of memory that should be erased during a programming/debug cycle.
-
Skip programming - specifies that no programming should occur. The tool will try to attach to the program already in memory.
-
Erase only program area - specifies that only the program area of memory should be erased.
-
Erase entire chip - specifies that the entire chip is to be erased.
The 'Preserve Eeprom' option lets you decide whether EEPROM data should be written when launching a debug session. The EESAVE fuse will be set and cleared accordingly.
When a device is programmed at the start of a debug session, the default behavior is to erase the content of the device (chip erase, if available). This can be changed by selecting a different option from the drop-down box under 'Programming settings'.
Keep timers running in stop mode
When checked, the timers set in the program will continue to run even when the program breaks at breakpoint or is halted
This setting is enabled for only certain tool/interfaces.
Override Vector Table Offset Register
At reset, load PC and SP from the specified address.