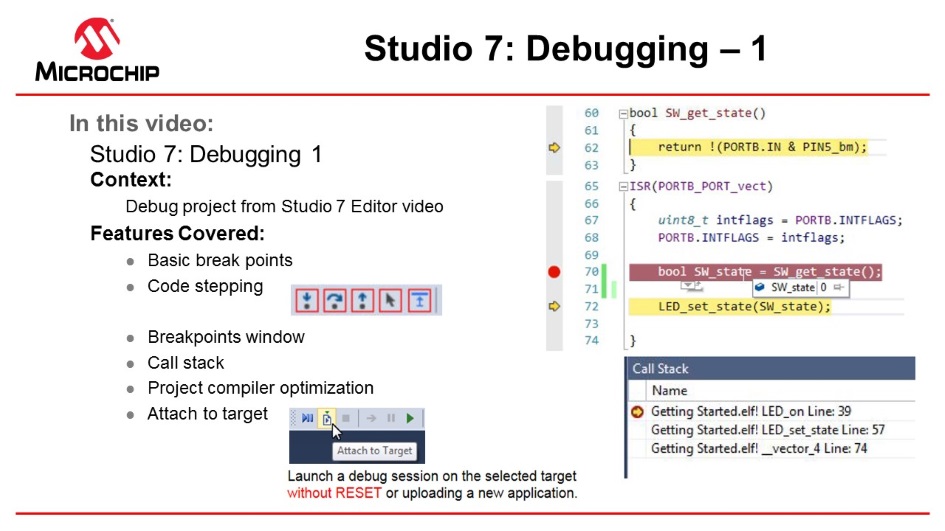
This section will introduce the debugging capabilities of Studio 7, both as video (linked below) and hands-on document. The main topics are breakpoints, basic code stepping using the Breakpoint, and Callstack-Windows, as well as adjusting project compiler optimization settings.
The same code as the one created in section Editor: Writing and Re-Factoring Code (Visual Assist), is used.
Todo: Place a
breakpoint and inspect a list of all breakpoints in the project.
- 1.Set a breakpoint on the line getting the
switch state, as indicated in Figure 1.Figure 1. Placing a Breakpoint
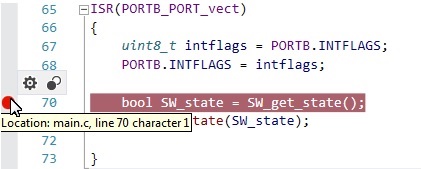 Info: A breakpoint can be placed at a line of code by:
- Clicking the gray bar on the left edge of the editor window.
- In the top menu bar, go to Debug → Toggle Breakpoint.
- By pressing F9 on the keyboard.
- 2.Launch a debug session
 . The
breakpoint will be hit when the switch (SW0) on the Xplained Pro kit is pressed.
Observe that execution is halted when the breakpoint is hit, and the execution arrow
indicates that the line of code where the breakpoint is placed is about to execute.
See Figure 2.Figure 2. Execution Halting when a Breakpoint is Hit
. The
breakpoint will be hit when the switch (SW0) on the Xplained Pro kit is pressed.
Observe that execution is halted when the breakpoint is hit, and the execution arrow
indicates that the line of code where the breakpoint is placed is about to execute.
See Figure 2.Figure 2. Execution Halting when a Breakpoint is Hit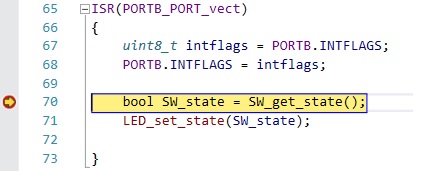 Tip: If a breakpoint is hit in a file that is not currently open, Atmel Studio will open the file in a temporary pane. A file containing a breakpoint that is hit in a debug session will always be brought to focus.
 - 3.Since most of the logic of the program is
handled only when an ISR is processed, it is now possible to check the logical flow
of the program. If the switch is pressed and then released when the ISR is hit -
what will be the state of the switch that the function returns? The assumption is
that since pressing the switch triggered the interrupt, that switch will be set as
pressed, and the LED will thus be turned ON. Code stepping can be used to check this assumption. The key buttons used for code stepping are illustrated in the table below, found in the top menu bar or in the Debug menu. The corresponding functionality and keyboard shortcuts are outlined in the figure below.Figure 3. Atmel Studio Buttons for Code Stepping

Table 1. Atmel Studio Button Functionality (Code Stepping) Button Functionality Keyboard Shortcut 
Step Into Function Call F11 
Step Over F10 
Step Out of Function Call Shift + F11 
Run to Cursor Ctrl + F10 
Issue System Reset Todo: Find out what state is returned if the switch is pressed and then released when the ISR is hit. Is our assumption correct that since pressing the switch triggered the interrupt, it will be set as pressed, and the LED will thus be turned ON?
The Step Into Function Call
can be
used first. To go into the SW_get_state( ) function, the Step Out of Function
Call
can be
used to move to the next line after returning from the function. Pressing Step
Over
from
the breakpoint would land us at this same point directly. Note that we could step
further into the function LED_set_state(SW_state) to determine if the LED is
turned ON or not. However, we could simply hover the mouse pointer over the
SW_state variable to see that it is now set to 0, i.e. the LED will be turned
OFF. Verify this by stepping further. 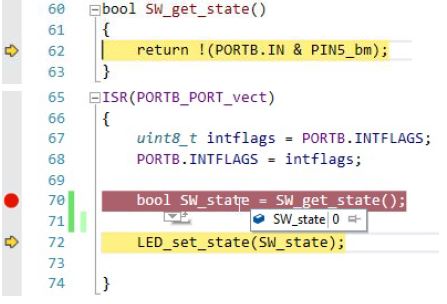
can be
used first. To go into the SW_get_state( ) function, the Step Out of Function
Call
can be
used to move to the next line after returning from the function. Pressing Step
Over
from
the breakpoint would land us at this same point directly. Note that we could step
further into the function LED_set_state(SW_state) to determine if the LED is
turned ON or not. However, we could simply hover the mouse pointer over the
SW_state variable to see that it is now set to 0, i.e. the LED will be turned
OFF. Verify this by stepping further. Figure 4. Checking Value of
SW_state Using Mouse Hover
Info: Although the
breakpoint was triggered by the falling edge by pressing the switch, only when
calling the SW_get_state( ) function the switch state is recorded. Verify
that SW_state will read 1 if the switch is held down when stepping over
this line.
this line.- 1.A window or view to keep track of the
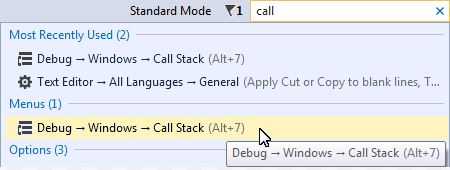
breakpoints in a program is needed. The Quick Launch bar performs a search of the
Studio 7 user interface menus. This is demonstrated below, by comparing the two
figures Figure 5 and Figure 6. Note that each of the hits in the Quick Launch bar
is from 'break' related entries in the Debug menu. Figure 5. 'Break' Search in the Quick Launch Bar
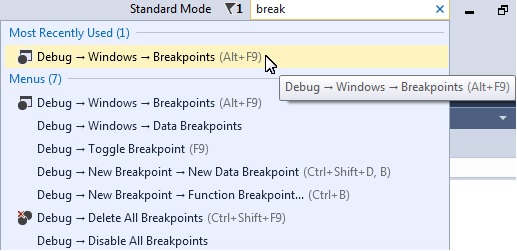 Figure 6. 'Break' Hits in Debug Menu
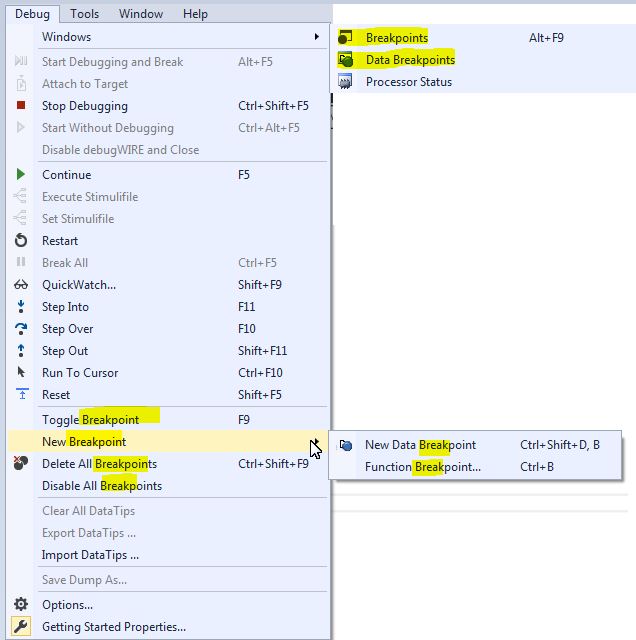
Open the Breakpoints Window by clicking on the top result (Debug → Windows → Breakpoints). The Breakpoints Window lists all the breakpoints in the project, along with the current hit count, as depicted in Figure 7.
Tip: A breakpoint can temporarily be disabled by unchecking the checkbox next to a breakpoint in the list.Tip: The Disassembly view can be conveniently displayed alongside the source code, as demonstrated in the Figure 8 section.Figure 7. Breakpoints Window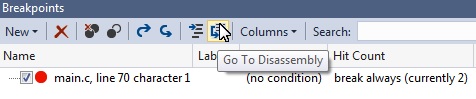 Figure 8. Disassembly View
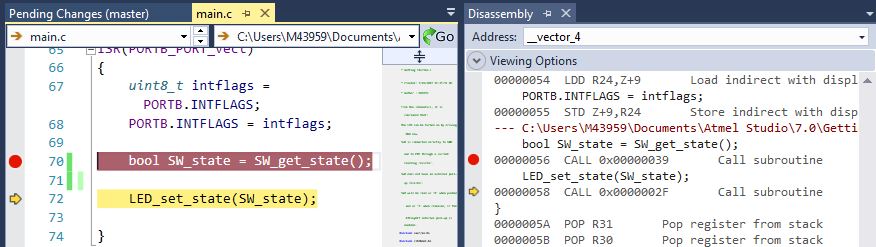
Todo: Examine the
Call Stack and the effect on it when optimizations are disabled.
- 1.Following from the previous section, set a breakpoint on the LED_on() function, then trigger the breakpoint so that it is hit.
- 2.Open the Call Stack window by typing 'Call'
in the Quick Launch bar, selecting Debug → Windows → Call Stack, as
represented in Figure 9. Note: A debug session needs to be active to open this window.Figure 9. Open the Call Stack Window
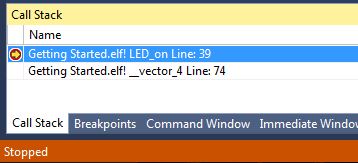
- 3.It would be expected that the Call Stack
shows LED_set_state() as the caller of
LED_on(), since that's how the code is
written. However, in the Call Stack window, _vector_4 is listed as
the caller (as in Figure 10); this is because of compiler optimization.
Figure 10. Call Stack with Optimization
 Info: The call order is different because of the compiler optimization. This code is relatively simple to follow and it is possible to understand what is going on even though the compiler has optimized and made subtle changes to what is expected. In a more complex project, it can sometimes be helpful to disable the compiler optimization to track down a bug.Note: To see why the Call Stack shows that it comes from _vector_4 initially, click on PORTB_PORT_vect and look in the context field for the definition, as shown in Figure 11.Figure 11. __vector_4 is the PORTB ISR Vector
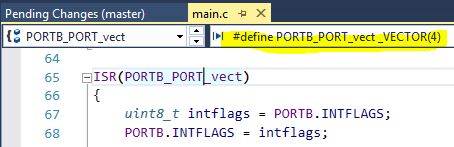
- 4.Stop debugging by clicking
the Stop Debugging button
 or pressing Shift + F5.
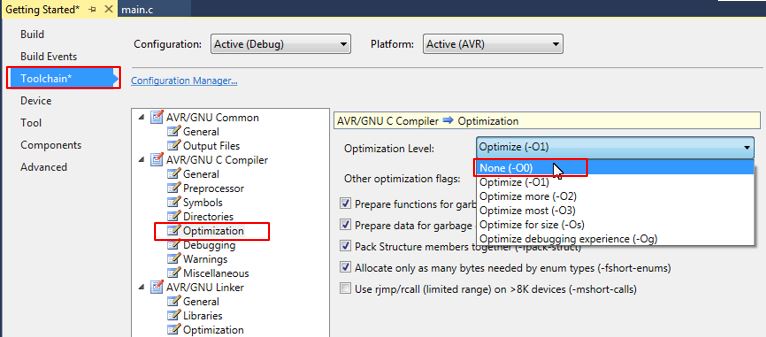
 - 5.Open the project settings by going to Project → <project_name> properties or pressing Alt + F7. Go to the Toolchain tab on the left menu, as in Figure 12.
- 6.Under AVR/GNU C Compiler →
Optimization, set the Optimization Level to None (-O0)
using the drop-down menu.Figure 12. Disabling Compiler Optimizations
 Warning: Disabling compiler optimization will result in increased memory consumption and can result in changes in execution timing. This can be important to consider when debugging time is a critical code.
 - 7.Launch a new debug session and break code execution inside LED_on().
- 8.Observe the Call Stack. It should now adhere
to how the code is actually written and list LED_set_state() as the caller of LED_on(), as shown in Figure 13.Figure 13. Call Stack Without Optimization

Tip: Atmel Studio
will try to link the compiled code to the source-code as best it can, but the
compiler optimization can make this challenging. Disabling compiler optimization
can help if breakpoints seem to be ignored during debugging, or if the execution
flow is hard to follow during code stepping.
Result: The call stack has now been examined both with and without optimization
enabled.
Code used for Debugging 1
/*
 LED is turned on when switch is pressed, LED is turned on (via a pin change interrupt).
 MY_mistake() written to demonstrate Attach to Target, is commented out, to avoid hanging
 project unintentionally.

 From the schematics, it is concluded that:
 The LED can be turned on by driving PB4 low.
 SW0 is connected directly to GND and to PB5 through a current limiting resistor.
 SW0 does not have an external pull-up resistor.
 SW0 will be read as '0' when pushed and as '1' when released, if the ATtiny817 internal pull-up is enabled.
*/

#include <avr/io.h>
#include <stdbool.h>
#include <avr/interrupt.h>

void LED_on();
void LED_off();
bool SW_get_state();
void LED_set_state(bool SW_state);

int main(void)
{
	PORTB.DIRSET = PIN4_bm;
	PORTB.OUTSET = PIN4_bm;
 	PORTB.PIN5CTRL |= PORT_PULLUPEN_bm | PORT_ISC_BOTHEDGES_gc;
	sei();

    while (1)
    {
    }
}

#pragma region LED_functions
void LED_on()
{
	PORTB.OUTCLR = PIN4_bm;  //LED on
}

void LED_off()
{
	PORTB.OUTSET = PIN4_bm;  //LED off
}

void LED_set_state(bool SW_state)
{
	if (SW_state)
	{
		LED_on();
	}
	else
	{
		LED_off();
	}
}
#pragma endregion LED_functions

bool SW_get_state()
{
	return !(PORTB.IN & PIN5_bm);
}

/*
void My_mistake()
{
	while(1)
	{
		asm("nop");
	}
}
*/

ISR(PORTB_PORT_vect)
{
	uint8_t intflags = PORTB.INTFLAGS;
	PORTB.INTFLAGS = intflags;
	//My_mistake();

	bool SW_state = SW_get_state();

	LED_set_state(SW_state);

}