The Data Breakpoint window provides the options to set data breakpoint and lists the added data breakpoints. Enable this window by choosing Debug → Windows → Data Breakpoints.
The Data Breakpoints toolbar has the following elements:
-
 - provides the data
breakpoint configuration window to add a new data breakpoint.
- provides the data
breakpoint configuration window to add a new data breakpoint. -
 - provides the data
breakpoint configuration window to edit the selected data
breakpoint.
- provides the data
breakpoint configuration window to edit the selected data
breakpoint. -
 - removes the selected data breakpoint. You can invoke the same
command using the Delete key.
- removes the selected data breakpoint. You can invoke the same
command using the Delete key. -
 - removes all the data breakpoints.
 -
 - enable or
disable all the data breakpoints.
- enable or
disable all the data breakpoints.
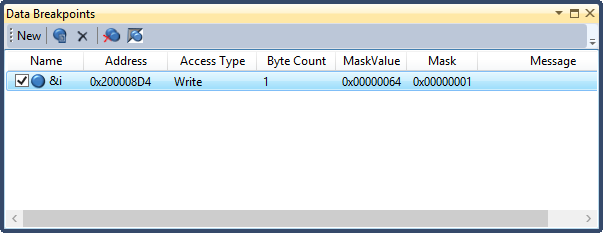
The Data Breakpoints window displays several columns related to breakpoint configuration. Some of the columns are dynamically hidden based on the breakpoints configuration. E.g.: if none of the breakpoints has Mask configured, then Mask related columns are not displayed.
Name column has three parts:
- Checkbox - Use Checkbox to enable or disable the breakpoint.
- Icon - Glyph to represent the current state of the breakpoint. The following table describes these glyphs. If you rest the mouse on a breakpoint glyph, a breakpoint tip appears with more information. This information is especially useful for error and warning breakpoints.
- Text - Displays
the configured location expression for the breakpoint.
Table 1. Breakpoint Icons Icon Description 

Normal breakpoint. The solid glyph indicates that the breakpoint is enabled. The hollow glyph indicates that it is disabled.


Advanced breakpoint. Active/disabled. The + sign indicates that the breakpoint has hit count attached to it.


Tracepoint. Active/disabled. Hitting this point performs a specified action but doesn't break program execution.


Advanced tracepoint. Active/disabled. The + sign indicates that the tracepoint has hit count attached to it.


Breakpoint or tracepoint error. The X indicates that the breakpoint or tracepoint couldn't be set because of an error condition. Check Message column for more details on the error message.


Breakpoint or tracepoint is set but with a warning. Check Message column for more details on the warning message.