This section gives an example on how to configure the Dashboard module. Although the example utilizes only a subset of the available dashboard elements data sources available in the Data Visualizer, the basic principles are applicable to all elements and data sources.
This example uses manual configuration of the Dashboard module, but it is also possible to use the Atmel Data Protocol (ADP) to set up a dashboard automatically. For more information on ADP and an example of a automatically configured dashboard, see Atmel Data Protocol.
The target application code used in this example and a description of the hardware setup can be found in Dashboard Example Code.
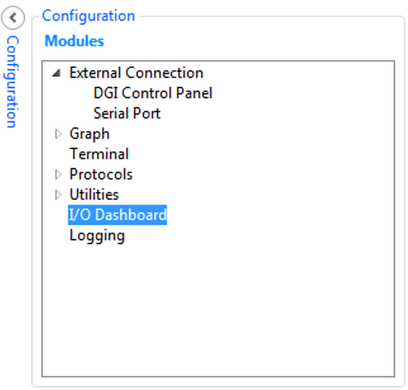
- Open the configuration panel
- Add a new I/O Dashboard component by double-clicking the I/O Dashboard module
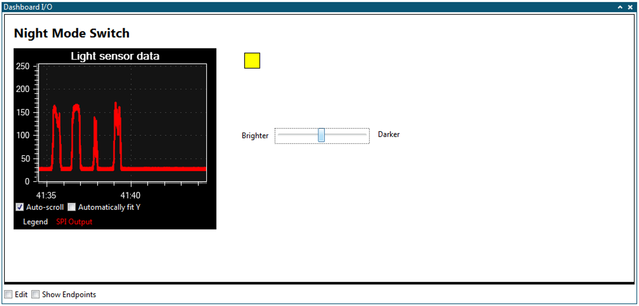
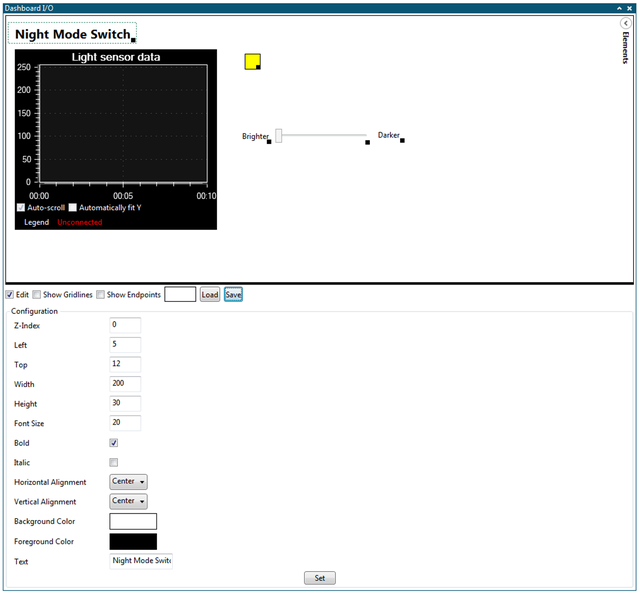
- Enable editing the dashboard by clicking the Edit option in the lower left corner of the Dashboard I/O module
- Open the Elements panel in the upper right corner of the dashboard and drag elements onto the dashboard.
When the dashboard has been set up it is time to connect the dashboard to the serial interfaces to enable communication with the target application.
Before the endpoints in the dashboard can be hooked up, the interfaces between the target board and the host computer must be configured. This example uses the DGI SPI interface and the CDC USART interface. The CDC interface will appear on the host computer as an ordinary serial COM port.
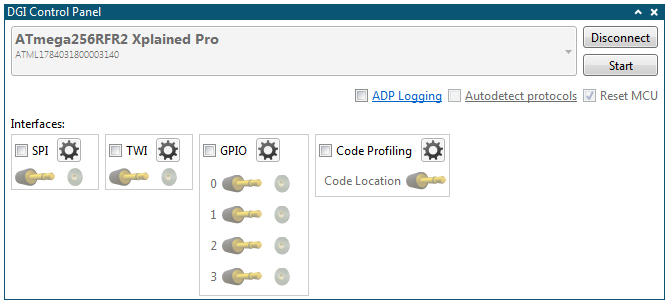
- Click the SPI checkbox
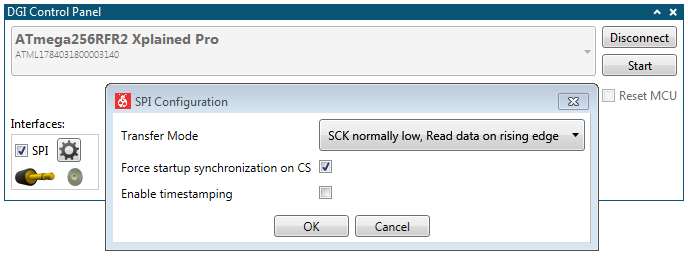
- Open the SPI Configuration dialog by clicking the Gear button next to the SPI checkbox
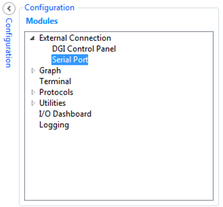
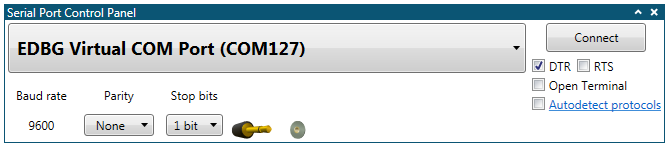
- Open the Serial Port Control panel found under External Connection in the Modules section of the Configuration tab in Data Visualizer
- Select the correct COM port corresponding to the connected kit
- Set the serial port parameters according to the application code
- Make sure the Open Terminal option is not checked
- Deselect the Edit option
- Click the Show Endpoints option
- Drag the SPI source to the graph sink
- Drag the serial port source to the signal sink
- Drag the slider source to the serial port sink
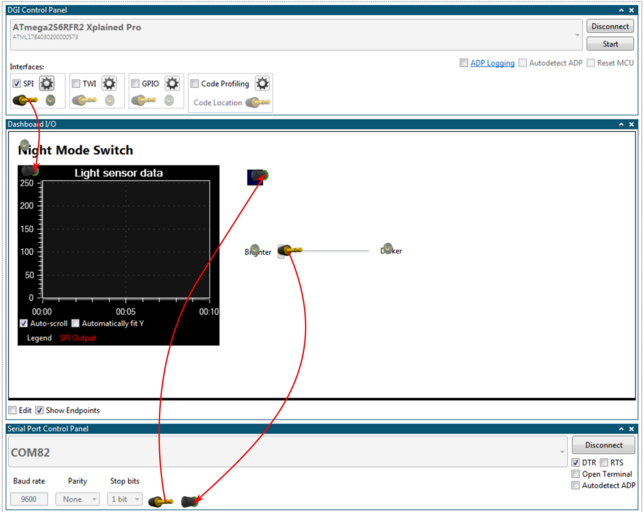
- Deselect the Show Endpoints option
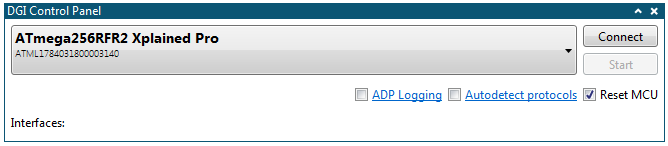
- Click Start in the DGI Control Panel
- Click Connect in the Serial Port Control Panel