The tables below describe the ELEMENT_TYPE_GRAPH specific parameters and additional fields for the MSG_CONF_DASHBOARD_ELEMENT message. This element generates a graph that visualizes the data from the target. There will be one input stream for each plot.
| Parameter | Value |
|---|---|
| ELEMENT_TYPE | 0x06 |
| Total data length of MSG_CONF_DASHBOARD_ELEMENT when using ELEMENT_TYPE_GRAPH | 41 + length of title (N) |
| Field | Size | Values | Description |
|---|---|---|---|
| Title color | 3 bytes | 0xRRGGBB | RGB color of title |
| Background color | 3 bytes | 0xRRGGBB | RGB color of graph frame |
| Graph background color | 3 bytes | 0xRRGGBB | RGB color of graph |
| Title text | N bytes | Null-terminated string max. 20 bytes | |
| Plot count | 1 byte | 1-10 | Number of plots |
| Xmin | 4 bytes | Floating point, seconds | Will be converted to <minutes>:<seconds> format |
| Xmax | 4 bytes | Floating point, seconds | Will be converted to <minutes>:<seconds> format |
| Ymin | 4 bytes | Floating point | |
| Ymax | 4 bytes | Floating point | |
| Mode | 1 byte |
|
Example
The picture below shows an example of a graph element with tree input plot inputs. The element data fields for the example is shown in the table below the picture.
Note: The appearance of elements will vary with operating system version
and configuration.
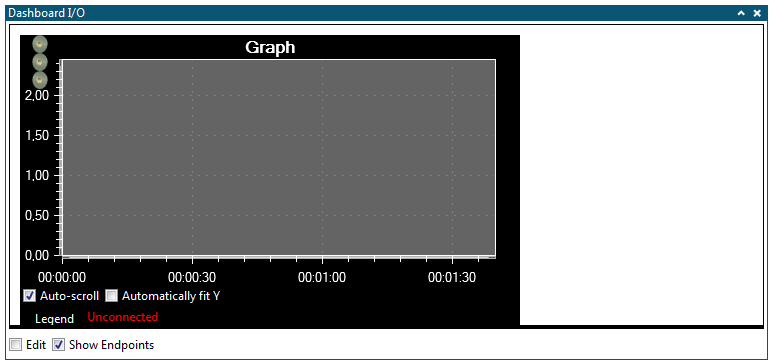
| Field | Value |
|---|---|
| Z-index | 0 |
| X-coordinate | 10 |
| Y-coordinate | 10 |
| Width | 500 |
| Height | 250 |
| Element type | 0x06 |
| Title color | 0xFFFFFF |
| Background color | 0x000000 |
| Graph background color | 0x646464 |
| Title text | “Graph\0” |
| Plot count | 3 |
| Xmin | 0 |
| Xmax | 100 |
| Ymin | 0 |
| Ymax | 2.45 |
| Mode | 0x01 |