This chapter gives an example on how to configure the Graph module to be used with a target application implementing a Night mode switch with a light sensor. Although this example utilizes only some of the data sources available in the Data Visualizer, the procedure will be the same for all data sources. The target code used in this example and a description of the hardware setup can be found in the Graph Example Code chapter. The first part of the configuration example uses the code found in the first subsection of the Graph Example Code chapter (Basic Graph). When changes to the target application code are required as the example progress a link to the corresponding code listing will be provided.
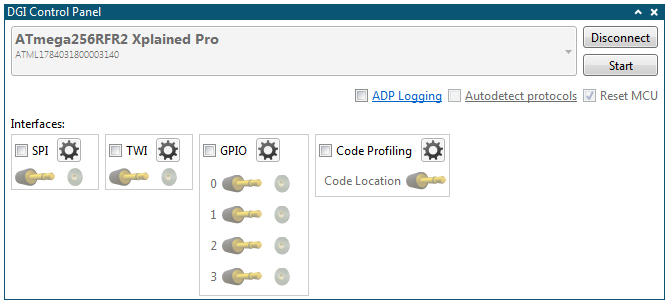
- Click the SPI checkbox
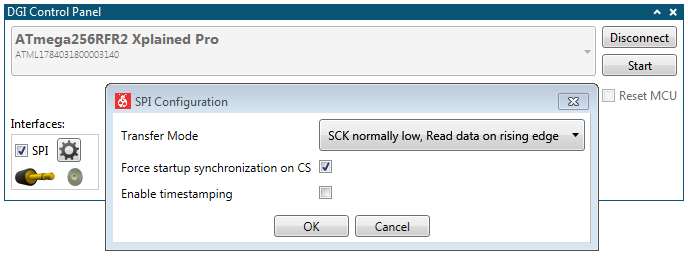
- Open the SPI Configuration dialog by clicking the Gear button next to the SPI checkbox
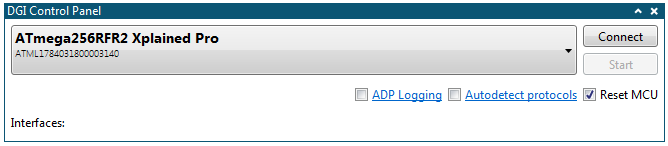
- Open the configuration panel
- Add a Graph module to the Data Visualizer
- Drag the source connector from the interface in the DGI Control Panel into the sink marked New plot to make a connection to a new plot
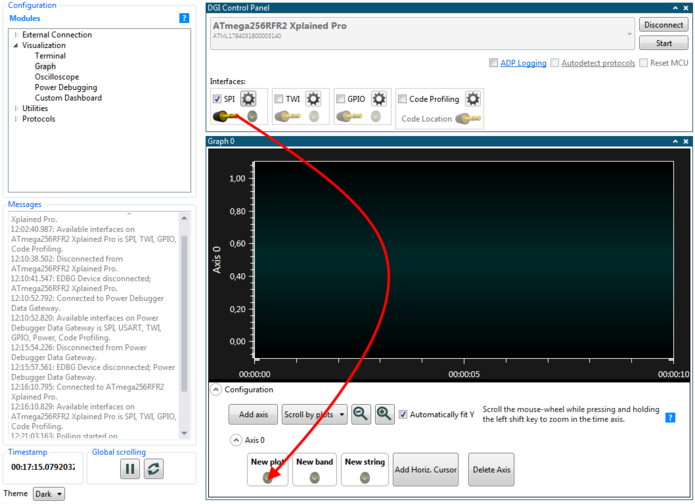
- Push Start in DGI Control Panel
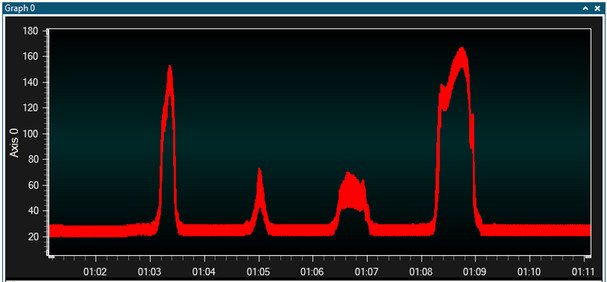
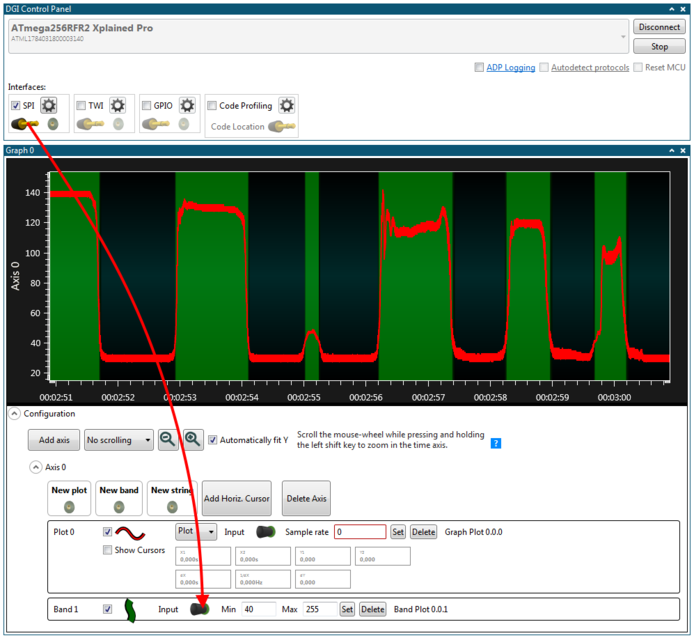
The light sensor data can be used to switch between Day and Night mode. For the Night mode switch to be useful, the threshold when switching between the modes are important. The Graph module contains a useful feature called Band to mark when the plot data is within a certain range. This can be used to simplify the selection of the mode switch threshold.
- Drag the interface source to the New band sink
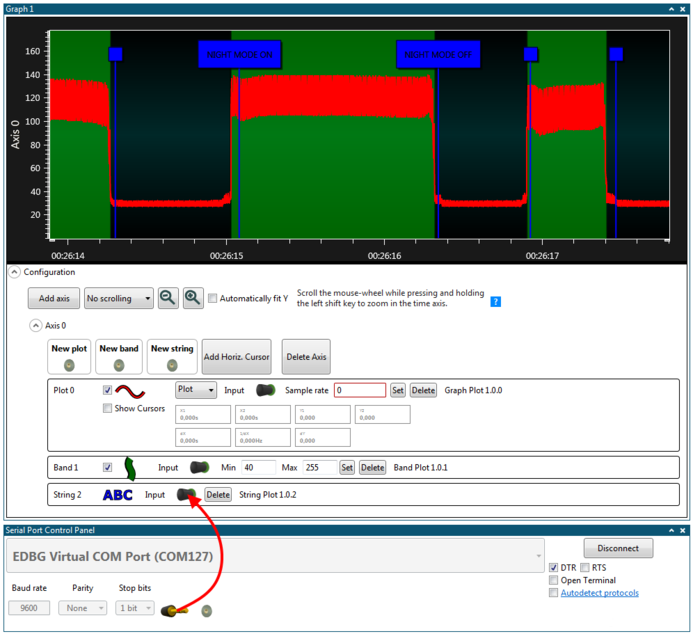
To see that the Night mode switch is actually working and switching at the right threshold, the string marker feature of the Graph module is useful. In this example, the CDC USART interface of the target board is used to send a string each time the mode is switched. These messages can then be shown in the graph as string markers. The target application source code for this part of the configuration example can be found in Adding String Markers.
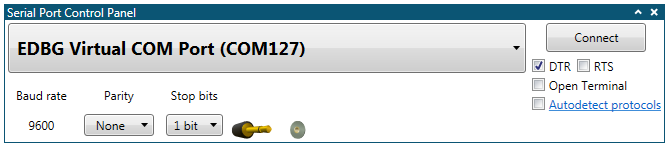
- Open the Serial Port Control panel found under External Connection in the Modules section of the Configuration tab in Data Visualizer
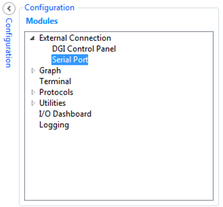
- Select the correct COM port corresponding to the connected kit
- Set the serial port parameters according to the application code
- Make sure the Open Terminal option is not checked
- Drag the serial port source to the New string sink
- Click Connect in the Serial Port Control Panel
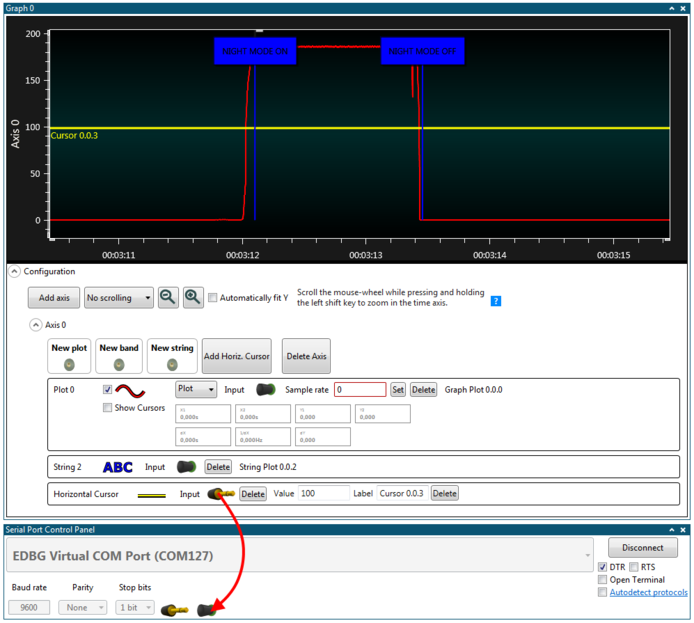
So far, the Graph module of the Data Visualizer has been used to show the data generated by the light sensor and to show when the Night mode switch toggles between the two modes. The Graph module can also be used to interact with the target application while it is running. In this example, the Night mode threshold can be adjusted dynamically by using a horizontal cursor.
The target application source code for this part of the configuration example can be found in Using Horizontal Cursor Code.
- First, remove the band from the graph as it is of no use when the Night mode threshold is dynamic
- Click Add Horiz. Cursor to add a horizontal cursor to the graph
- Drag the Horizontal Cursor source to the sink in the Serial Port Control Panel