An example on how to use Program Counter sampling for power consumption analysis can be found in Program Counter Polling. The same Mass Storage Class example used in this section is also suited as an example on how to use the data polling and control of data variables features. A SAM L21 Xplained Pro board is connected to a host computer both through Target USB and Debug USB connectors on the kit. The ATSAML21 target device is running the USB Device MSC Example from ASF for SAM L21 Xplained Pro.
For more information on the hardware setup and target application code used in this example, see Data Polling Example Code.
Although this example makes use of the Graph and Dashboard modules the principles are the same for using the Code Profiling interface with the other modules in the Data Visualizer.
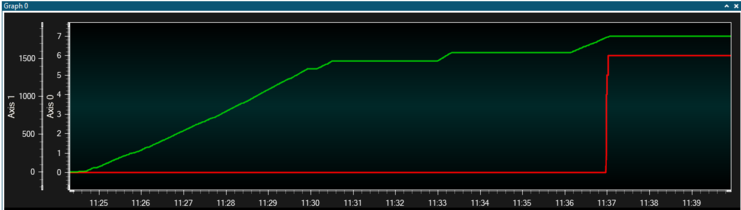
First, a graph will be set up to monitor variables in the target application.
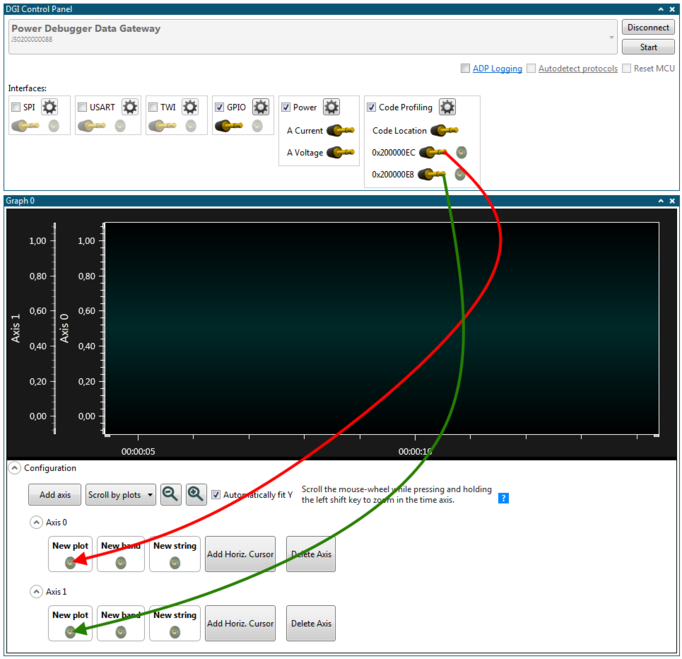
- Enable the Code Profiling interface by deselecting the check box for the Code Profiling interface in the DGI Control Panel
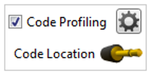
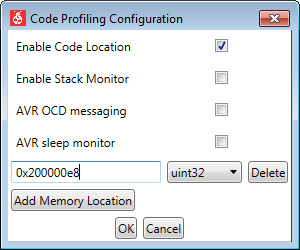
- Open the Code Profiling Configuration window by pushing the Gear button
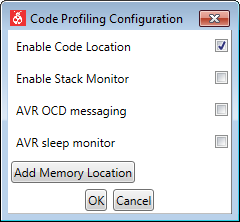
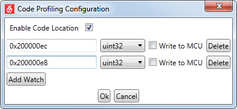
- Click the Add Memory Location button for each memory location to be added
- Fill in the address and format of each location
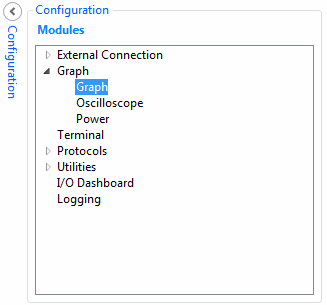
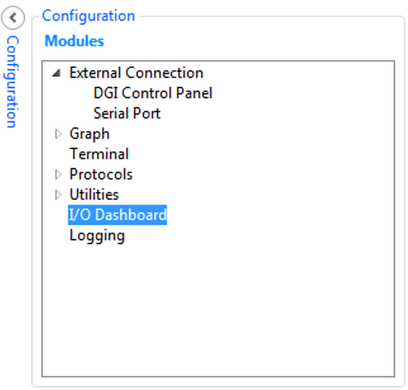
- Open the Configuration panel in Data Visualizer
- Add a graph by double-clicking the Graph module
A new Graph element will open with one y axis configured. However, there are two unrelated variables to monitor, therefore, two axes are needed.
- Click the Add axis button to add an additional axis
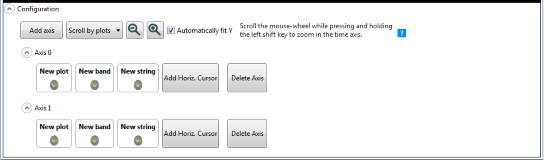
There are now sources (variables) and sinks (axes), to be connected together.
The following part of this example shows how to use a dashboard to interact with the target application. For more information on the required code changes in the target application, see Application Interaction using Dashboard Controls.
- Open Data Visualizer
- Connect
- Add the location of the frame_comparator in the Code Profiling Configuration window
- Open the configuration panel
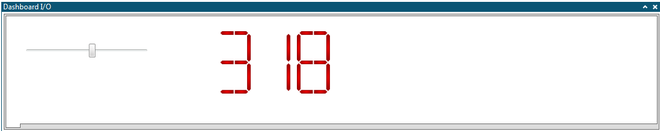
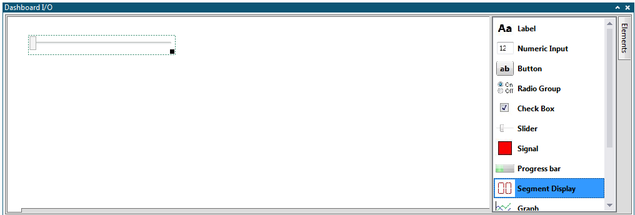
- Add a new I/O Dashboard component by double-clicking the I/O Dashboard module
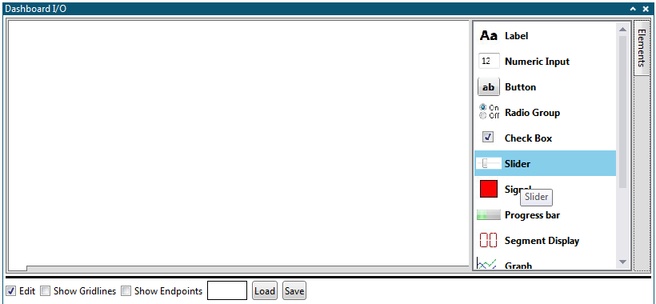
A slider control can now be added to the dashboard.
- Select the Edit checkbox
- Open the Elements tab
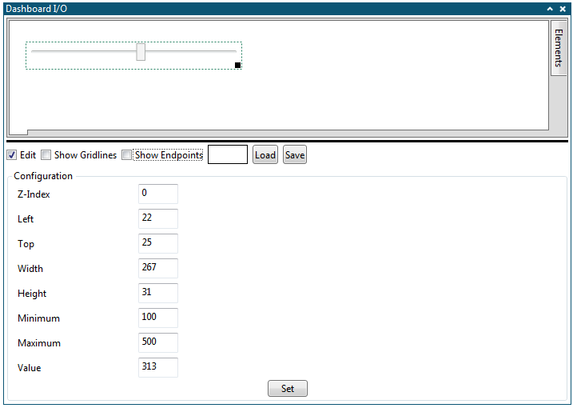
- Drag a Slider element onto the dashboard
- Maximum = 500
- Minimum = 100
- Select the Edit checkbox
- Open the Elements tab
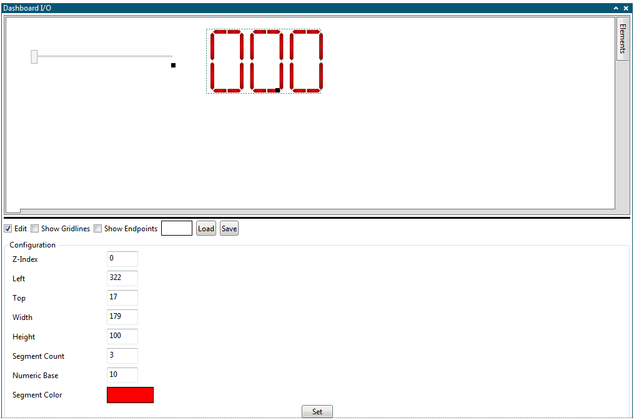
- Drag a Segment Display element onto the dashboard
- Segment Count = 3
The Code Profiling data polling interface provides both a source of data and a sink of data. The slider can now be connected to the sink and the segment display to the source.
- Deselect the Edit checkbox
- Select the Show Endpoints checkbox
- Connect sources to sinks by dragging each source plug and drop it on a sink
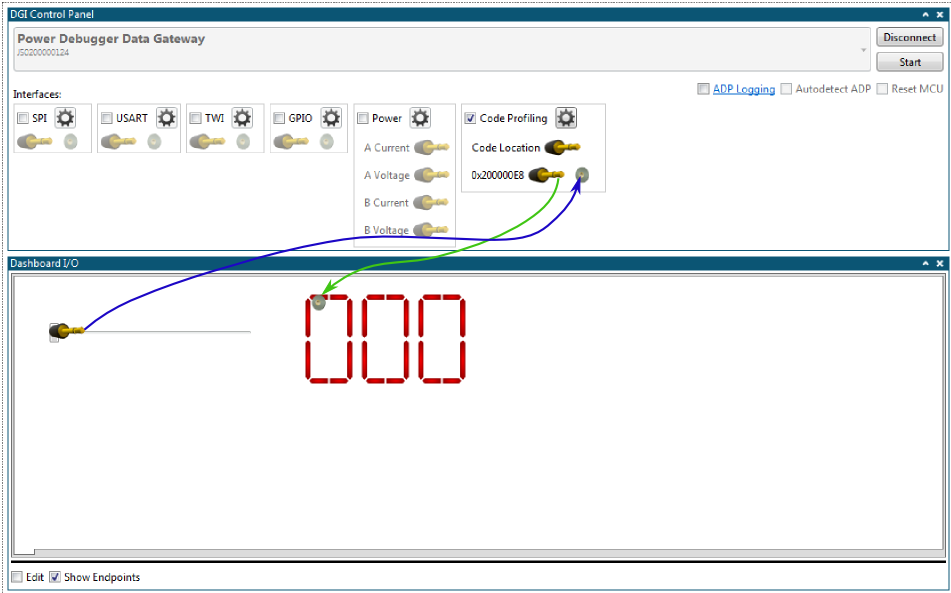
- Deselect the Show Endpoints checkbox
- Start Data Visualizer
- Resume execution in Atmel Studio (F5)